 Back
BackProbability Distributions and Binomial Probability Distributions: Study Notes for Statistics Students
Study Guide - Smart Notes
 Tailored notes based on your materials, expanded with key definitions, examples, and context.
Probability Distributions
Random Variables
A random variable is a variable, typically denoted by x, that takes a single numerical value determined by chance for each outcome of a procedure. Random variables are fundamental in statistics as they allow us to quantify outcomes of random processes.
Discrete random variable: Has a collection of values that is finite or countable (e.g., number of heads in coin tosses).
Continuous random variable: Has infinitely many values, not countable, often measured on a continuous scale (e.g., body temperature).
Probability Distribution
A probability distribution describes the probabilities for each value of a random variable. It can be represented as a table, formula, or graph.
Requirements for a probability distribution:
The random variable x must be numerical.
The sum of all probabilities must be 1: (allowing for rounding errors).
Each probability must be between 0 and 1: .
Example: Coin Toss
When two coins are tossed, the random variable x represents the number of heads. The possible values are 0, 1, or 2, each with associated probabilities.
The probability distribution for this experiment is:
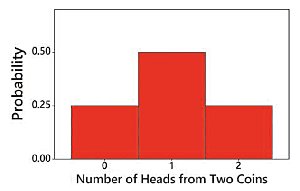
The above histogram visually represents the probability distribution for the number of heads when two coins are tossed.
Probability Distribution Table Example
x | P(x) |
|---|---|
0 | 0.25 |
1 | 0.50 |
2 | 0.25 |
This table satisfies all requirements for a probability distribution.
Significant Results in Probability
Statisticians often determine whether outcomes are significantly high or significantly low using probability thresholds:
Significantly high:
Significantly low:
The threshold (0.05) is not rigid; other values like 0.01 may be used.
The Rare Event Rule states: If, under a given assumption, the probability of a particular outcome is very small and the outcome occurs significantly less or more than expected, the assumption is probably not correct.
Parameters of Probability Distributions
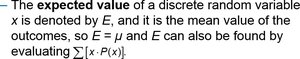
Expected Value (Mean)
The expected value of a discrete random variable x is denoted by E and is the mean value of the outcomes. It is calculated as:
Variance and Standard Deviation
The variance and standard deviation measure the spread of a probability distribution:
Variance:
Standard deviation:
Example Calculation: Coin Toss
For the probability distribution of the number of heads when two coins are tossed:
x | P(x) | x · P(x) | (x − μ)2 · P(x) |
|---|---|---|---|
0 | 0.25 | 0.00 | 0.25 |
1 | 0.50 | 0.50 | 0.00 |
2 | 0.25 | 0.50 | 0.25 |
Total | 1.00 | 1.00 | 0.50 |
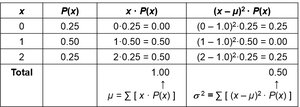
Mean: Variance: Standard deviation:
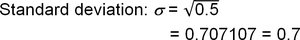
Interpretation: The mean number of heads is 1.0, variance is 0.50, and standard deviation is 0.7.
Binomial Probability Distributions
Definition and Requirements
A binomial probability distribution arises from a procedure that meets four requirements:
Fixed number of trials (n).
Trials are independent.
Each trial has two possible outcomes: success or failure.
The probability of success (p) remains constant for all trials.
When sampling without replacement, if the sample size is no more than 5% of the population, selections can be treated as independent (5% guideline).
Notation
S and F: Success and failure.
n: Number of trials.
x: Number of successes in n trials.
p: Probability of success in one trial.
q: Probability of failure in one trial ().
P(x): Probability of getting exactly x successes.
Binomial Probability Formula
The probability of getting exactly x successes in n trials is:
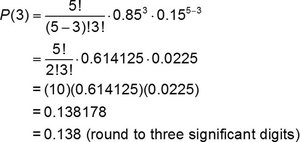
Example: Twitter Awareness
Suppose the probability that an adult knows what Twitter is (p) is 0.85. For five randomly selected adults (n = 5), the probability that exactly three know Twitter (x = 3) is:
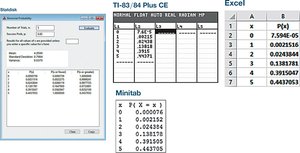
Methods for Finding Binomial Probabilities
Method 1: Use the binomial probability formula.
Method 2: Use technology (statistical software, calculators, or spreadsheets) to generate probability tables.
Interpreting Binomial Results
To determine if a result is significantly high or low, use:
Probability thresholds ( for significance).
Range rule of thumb: Significantly low values ; significantly high values .
Example: NFL Overtime Wins
Given 460 games, mean number of wins is , standard deviation . Significantly low values are , significantly high values are . The result of 252 wins is significantly high.
Summary Table: Binomial Probability Distribution Parameters
Parameter | Formula |
|---|---|
Mean | |
Variance | |
Standard Deviation |
Key Takeaways
Probability distributions describe the likelihood of outcomes for random variables.
Discrete and continuous random variables have different properties and distributions.
Binomial distributions model scenarios with fixed trials, two outcomes, and constant probability of success.
Mean, variance, and standard deviation are essential parameters for understanding distributions.
Statistical significance is determined using probability thresholds and the range rule of thumb.
