 Back
BackProbability Distributions and the Binomial Distribution
Study Guide - Smart Notes
 Tailored notes based on your materials, expanded with key definitions, examples, and context.
Chapter 5: Probability Distributions
Section 5.1: Probability Distributions
Probability distributions describe how probabilities are distributed over the values of a random variable. They are fundamental in statistics for modeling random phenomena and making predictions.
Requirement 1: The probability of each event in the sample space must be between or equal to 0 and 1.
Requirement 2: The sum of the probabilities of all the events in the sample space must equal 1.
Definitions
Discrete Random Variable: A variable that has a countable number of possible values (e.g., number of heads in coin tosses).
Continuous Random Variable: A variable that can take on infinitely many values, not countable (e.g., time, weight).
Parameters of a Probability Distribution
For a probability distribution, the mean, variance, and standard deviation are parameters (since they describe the entire population, not just a sample).
Mean (Expected Value), \( \mu \):
Variance, \( \sigma^2 \):
Standard Deviation, \( \sigma \):
Examples of Discrete Probability Distributions
Rolling a Single Die: The probability distribution for the outcome of rolling a fair six-sided die is:
Outcome (x) | Probability P(x) |
|---|---|
1 | 1/6 |
2 | 1/6 |
3 | 1/6 |
4 | 1/6 |
5 | 1/6 |
6 | 1/6 |

Example: Construct a probability distribution for the number of items a customer selects at a store, with probabilities 0.32, 0.12, 0.23, 0.18, and 0.15 for 1, 2, 3, 4, and 5 items, respectively.
Number of Items (x) | Probability P(x) |
|---|---|
1 | 0.32 |
2 | 0.12 |
3 | 0.23 |
4 | 0.18 |
5 | 0.15 |
World Series Example
Suppose the number of games played in the World Series is recorded for 40 events. The probability distribution can be constructed by finding the probability for each possible number of games played (from 4 to 7).

Graphical Representation
Probability distributions can be represented graphically, such as with bar graphs or histograms, to visualize the likelihood of each outcome.
Determining Valid Probability Distributions
Check that all probabilities are between 0 and 1.
Check that the sum of all probabilities is exactly 1.
Expected Value
The expected value (mean) of a probability distribution is a measure of the center of the distribution, representing the average outcome if the experiment is repeated many times.
Section 5.2: The Binomial Distribution
The binomial distribution is a discrete probability distribution that models the number of successes in a fixed number of independent trials, each with the same probability of success.
Requirement 1: Fixed number of trials (n).
Requirement 2: Each trial has only two possible outcomes: success or failure.
Requirement 3: The trials are independent.
Requirement 4: The probability of success (p) is the same for each trial.

Binomial Probability Formula
The probability of getting exactly x successes in n trials is given by:
\( n \): Number of trials
\( x \): Number of successes
\( p \): Probability of success on a single trial
\( 1-p \): Probability of failure
Examples
Coin Toss: Toss a coin 3 times. Find the probability of getting exactly 2 heads.
Survey Example: If 10 people are selected at random and 1 out of 5 has visited a doctor, find the probability that exactly 3 have visited a doctor.
Teenage Jobs: If 5 teenagers are selected and 30% have part-time jobs, find the probability that at least 3 have jobs.

Practice Problem
In a survey, 58% of American adults use the Internet. If 20 are selected, find the probability that exactly 12 use the Internet.
World Series and Overtime Example
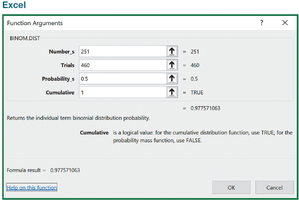
In 460 NFL games decided in overtime, 252 were won by the team that won the coin toss. To determine if this is significantly high, calculate the probability of 252 or more wins under the assumption of random chance (p = 0.5).
Methods for Finding Binomial Probabilities
Manual Calculation: Use the binomial probability formula.
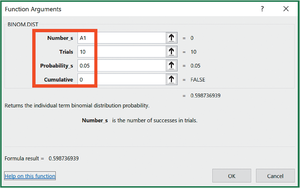
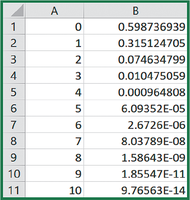
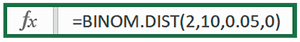
Using Excel: The BINOM.DIST function can compute binomial probabilities efficiently.
Significance Testing with Binomial Probabilities
To determine if an observed result is significantly high or low, compare the probability to a significance level (commonly 0.05). If the probability is less than 0.05, the result is considered significant.
Mean and Standard Deviation for Binomial Distributions
Mean:
Variance:
Standard Deviation:
Range Rule of Thumb
Significantly low values:
Significantly high values:
Values not significant: Between and
