 Back
Probability Distributions: Discrete, Binomial, and Normal Distributions
Study Guide - Smart Notes
 Tailored notes based on your materials, expanded with key definitions, examples, and context.
Probability Distributions
Random Variables and Probability Distributions
A random variable (RV) is a variable whose value is determined by chance. Probability distributions describe how probabilities are assigned to each possible value of a random variable.
Discrete random variable: Has countable outcomes (e.g., number of heads in coin flips).
Continuous random variable: Has infinitely many outcomes within an interval (e.g., height, weight).
Probability distribution: A table or function pairing each outcome with its probability.
Requirements for a probability distribution:
There is a numerical random variable x, and each possible outcome has a probability.
The sum of all probabilities for the RV must be 1.
Each probability must be between 0 and 1.
Example: Coin Flips
For two flips of a coin, the random variable X = number of heads. The probability distribution is:
X (Number of Heads) | P(X) |
|---|---|
0 | 0.25 |
1 | 0.5 |
2 | 0.25 |
Expected Value (Mean): The mean value of the outcomes, calculated as:
Standard Deviation: Measures the spread of the distribution:
Binomial Probability Distributions
A binomial probability distribution is a special case of discrete probability distributions, defined by parameters n (number of trials) and p (probability of success). It applies when:
There is a fixed number of trials.
Trials are independent.
Each trial has two possible outcomes: success or failure.
The probability of success remains constant for each trial.
The mean, variance, and standard deviation for a binomial distribution are:
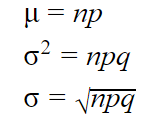
Where q = 1 - p (probability of failure).
Example: Archer Hitting Bull's-Eye
If an archer hits the bull's-eye 55% of the time and shoots 8 arrows, the probability of getting exactly 5 bull's-eyes is calculated using the binomial formula:
For n = 8, p = 0.55, k = 5:
Statistical software (e.g., StatCrunch) can be used for computation.
Example: NFL Overtime Games
In 460 games, 252 were won by the team winning the coin toss. This scenario satisfies binomial conditions:
Fixed number of trials (n = 460).
Two outcomes (win or lose).
Independent trials.
Constant probability (p = 0.5).
Mean and standard deviation:
Continuous Probability Distributions
A continuous probability distribution describes the probabilities of outcomes for a continuous random variable. The most important example is the normal distribution, which is symmetric and bell-shaped.
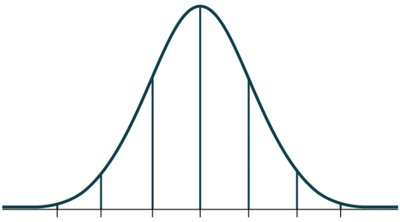
The normal distribution is defined by its mean (\( \mu \)) and standard deviation (\( \sigma \)).
A standard normal distribution is a normal distribution with \( \mu = 0 \) and \( \sigma = 1 \). Outcomes are transformed into z-scores:
Example: Bone Density Test
Bone density scores are normally distributed and measured as z-scores. The probability that a randomly selected adult has a z-score less than 1.27 is found using the normal distribution table or software.
Probability between two z-scores (e.g., -2.50 and -1.00) indicates the likelihood of osteopenia.
Finding z-scores for Given Probabilities
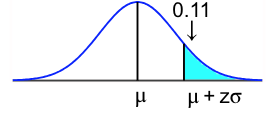
To find the z-score that separates the bottom 2.5% from the top 97.5%, use the standard normal table:
Example: Military Pilot Heights
Heights of men are normally distributed with \( \mu = 68.6 \) inches and \( \sigma = 2.8 \) inches. To find the percentage of men meeting height requirements (62 to 77 inches), calculate the probability that a value falls within this interval using z-scores.
To find the 15th percentile, solve for x:
Applications and Comparisons
Discrete vs. Continuous: Discrete random variables have countable outcomes; continuous random variables have uncountable outcomes within intervals.
Binomial vs. Normal: Binomial distributions can be approximated by normal distributions when n is large and p is not too close to 0 or 1.
Summary Table: Binomial vs. Normal Distribution
Distribution | Type | Parameters | Shape |
|---|---|---|---|
Binomial | Discrete | n, p | Symmetric for p=0.5, skewed otherwise |
Normal | Continuous | \( \mu \), \( \sigma \) | Symmetric, bell-shaped |
Key Formulas:
Binomial mean:
Binomial variance:
Binomial standard deviation:
Normal z-score:
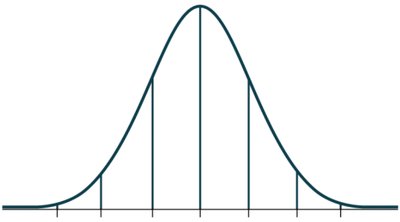
Example: Calculating the probability that a value falls above a certain z-score (e.g., right tail probability of 0.11) can be visualized as the shaded area under the normal curve.
