 Back
Probability Distributions: Discrete, Binomial, and Normal Distributions
Study Guide - Smart Notes
 Tailored notes based on your materials, expanded with key definitions, examples, and context.
Probability Distributions
Random Variables and Probability Distributions
A random variable (RV) is a variable whose value is determined by chance. Probability distributions describe how probabilities are assigned to each possible value of a random variable.
Discrete random variable: Has countable outcomes (e.g., number of heads in coin flips).
Continuous random variable: Has infinitely many outcomes within an interval (e.g., height, weight).
Probability distribution: A table or function pairing each outcome with its probability.
Expected value (mean): The average value of the random variable, denoted by E(X).
Requirements for a Probability Distribution:
Each outcome has a probability between 0 and 1.
The sum of all probabilities is 1.
Example: Coin Flips
For two flips of a coin, the random variable X is the number of heads. The probability distribution is:
X (Number of Heads) | P(X) |
|---|---|
0 | 0.25 |
1 | 0.5 |
2 | 0.25 |
Mean (Expected Value) and Standard Deviation:
Mean:
Variance:
Standard deviation:
Applications: Expected Value in Games
Expected value is used to evaluate choices in games of chance, such as roulette or betting scenarios. For example, calculating the expected value of different wagers helps determine which is statistically better.
Binomial Probability Distributions
Definition and Properties
A binomial probability distribution is a special case of discrete probability distributions, defined by the number of trials (n) and the probability of success (p). It applies when:
There is a fixed number of trials.
Each trial is independent.
Each trial has two possible outcomes: success or failure.
The probability of success remains constant.
Mean, Variance, and Standard Deviation for Binomial Distribution
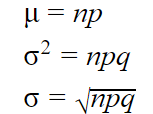
Mean:
Variance:
Standard deviation:
Example: Archer's Probability
If an archer hits the bull's-eye 55% of the time, the probability of getting exactly 5 bull's-eyes in 8 shots is calculated using the binomial formula:
Where
Normal Approximation to Binomial
For large n, the binomial distribution can be approximated by the normal distribution using the mean and standard deviation formulas above.
Continuous Probability Distributions
Normal Distribution
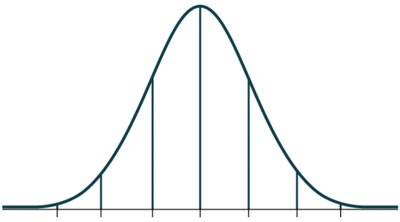
A normal probability distribution is a continuous distribution characterized by a symmetric, bell-shaped curve. It is defined by its mean () and standard deviation ().
Standard Normal Distribution
The standard normal distribution is a normal distribution with and . Values are transformed into z-scores to compare across different normal distributions.
Z-score:
Applications: Bone Density and Heights
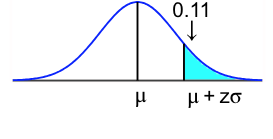
Normal distributions are used to calculate probabilities for real-world measurements, such as bone density scores or heights. For example, the probability that a randomly selected person has a bone density z-score less than 1.27 can be found using the normal distribution.
Percentiles and Probability
Percentiles in a normal distribution correspond to specific z-scores. For example, the 15th percentile of heights for men can be found by solving for x in the z-score formula.
Summary Table: Binomial vs. Normal Distribution
Distribution | Type | Parameters | Key Formula |
|---|---|---|---|
Binomial | Discrete | n, p | |
Normal | Continuous | , |
Additional info: The notes also reference using statistical software (StatCrunch) for calculations, which is common in introductory statistics courses.
