 Back
Chapter 5 Study Guide
Study Guide - Smart Notes
 Tailored notes based on your materials, expanded with key definitions, examples, and context.
Probability Distributions
Introduction to Probability Distributions
A probability distribution describes how probabilities are assigned to each possible value of a random variable. It provides a model for understanding the likelihood of different outcomes in a chance process.
Random Variable: A numerical outcome determined by chance, typically denoted by a capital letter (e.g., X).
Discrete Random Variable: Has finite or countable possible values (e.g., number of seedlings germinating).
Continuous Random Variable: Has infinitely many possible values on a continuum (e.g., plant height).
Example: If X = number of seedlings that germinate out of 3 planted seeds, possible values are 0, 1, 2, 3.
Requirements for a Valid Discrete Probability Distribution
X is numerical: The values represent a numerical random variable.
Sum of probabilities: (allowing small rounding differences).
Probability bounds: for every individual probability.
Representing Probability Distributions
Probability distributions can be represented using tables, formulas, or graphs. For example:
x (seedlings germinating) | P(x) |
|---|---|
0 | 0.10 |
1 | 0.25 |
2 | 0.40 |
3 | 0.25 |
Probability Histograms
A probability histogram visually displays a discrete probability distribution. The horizontal axis shows possible values of X, and the vertical axis shows P(x). Bar heights represent probabilities, not observed frequencies.
Describing a Probability Distribution: Mean, Variance, and Standard Deviation
The mean (expected value), variance, and standard deviation describe the center and spread of a probability distribution.
Mean (Expected Value):
Variance: or
Standard Deviation:
Example: For the table above, , , .
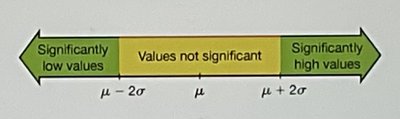
Identifying Unusual Outcomes: Range Rule of Thumb
The Range Rule of Thumb helps identify unusually low or high values in a probability distribution:
Unusually low:
Unusually high:
Values between these cutoffs are considered not significant. This is a heuristic, not a formal definition.
Probability-Based Unusual Outcomes: Alternatively, outcomes can be judged unusual if their probability is less than or equal to 0.05:
Unusually high:
Unusually low:
Binomial Probability Distributions
Binomial Model Requirements
A binomial probability distribution models the number of successes in a fixed number of independent trials, each with two outcome categories and a constant probability of success.
Fixed number of trials (n)
Independent trials
Two outcome categories (success/failure)
Constant probability of success (p)
Notation: n = number of trials, X = number of successes, x = particular value, p = probability of success, q = probability of failure ().
Binomial Probability Formula
The probability of exactly x successes in n trials is:
The combination component counts the number of ways to choose which x of the n trials are successes.
Mean and Standard Deviation of Binomial Distribution
Mean:
Variance:
Standard deviation:
Example: If n = 20 and p = 0.30, then , .
Identifying Unusual Outcomes in Binomial Distributions
Use the range rule of thumb or cumulative probabilities:
Unusually low:
Unusually high:
Probability-based: or
Poisson Probability Distributions
Poisson Model Requirements
A Poisson probability distribution models the number of occurrences of an event within a specified interval (time, distance, area, or volume).
Random occurrences
Independent occurrences
Uniformly distributed rate across the interval
Notation: X = number of occurrences, x = particular value, μ = mean number of occurrences per interval.
Poisson Probability Formula
The probability of exactly x occurrences in an interval is:
Where e is the mathematical constant (≈ 2.71828).
Mean and Standard Deviation of Poisson Distribution
Mean:
Variance:
Standard deviation:
Example: If μ = 9, then variance = 9, σ = 3.
Poisson Approximation to the Binomial
When n is large and p is small, a Poisson distribution can approximate a binomial distribution. For this course, use:
Then
Summary Table: Binomial vs. Poisson Models
Feature | Binomial | Poisson |
|---|---|---|
What is counted? | Successes in fixed trials | Occurrences in fixed interval |
Parameters | n, p | μ |
Possible values | 0, 1, ..., n | 0, 1, 2, ... (no upper limit) |
Mean | ||
Variance | ||
Standard deviation |
Key Takeaways
Probability distributions model the likelihood of outcomes for random variables.
Discrete distributions include binomial and Poisson models, each with specific requirements and formulas.
Mean, variance, and standard deviation describe the center and spread of distributions.
Unusual outcomes can be identified using the range rule of thumb or probability-based criteria.
