 Back
Probability Distributions, Expected Value, Binomial, and Normal Distribution Study Guide
Study Guide - Smart Notes
 Tailored notes based on your materials, expanded with key definitions, examples, and context.
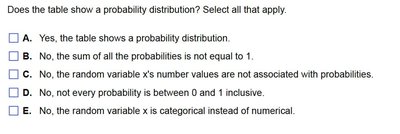
Q1. Does the table show a probability distribution? Select all that apply.
Background
Topic: Probability Distributions
This question tests your understanding of the requirements for a probability distribution table. You need to check if the table meets all the criteria for a probability distribution.
Key Terms and Formulas:
Probability Distribution: A table that lists each possible value of a random variable and its probability.
Requirements:
Each probability must be between 0 and 1 inclusive.
The sum of all probabilities must equal 1: .
The random variable must be numerical and each value must be associated with a probability.
Step-by-Step Guidance
Examine the values of and in the table. Are all values numerical?
Check if each probability is between 0 and 1 inclusive.
Add up all the probabilities in the table to see if their sum equals 1.
Verify that each value is associated with a probability.
Consider if is categorical or numerical.
Try solving on your own before revealing the answer!
Final Answer:
The table does not show a probability distribution. The sum of the probabilities is , which is not equal to 1. Also, all probabilities are between 0 and 1, and is numerical, so the only requirement not satisfied is the sum.
Correct choices: B (sum not equal to 1).
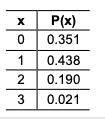
Q2. Groups of adults are randomly selected and arranged in groups of three. The random variable x is the number in the group who say that they would feel comfortable in a self-driving vehicle. Determine whether a probability distribution is given. If a probability distribution is given, find its mean and standard deviation. If a probability distribution is not given, identify the requirements that are not satisfied.
Background
Topic: Probability Distributions, Mean, and Standard Deviation
This question tests your ability to identify a probability distribution and, if valid, calculate its mean and standard deviation.
Key Terms and Formulas:
Probability Distribution: See previous question.
Mean (Expected Value):
Standard Deviation:
Step-by-Step Guidance
Check if all values are numerical and each is associated with a probability.
Verify that each probability is between 0 and 1 inclusive.
Add up all the probabilities to see if their sum equals 1.
If all requirements are satisfied, set up the formulas for mean and standard deviation using the values in the table.
Calculate and , but stop before the final calculation.
Try solving on your own before revealing the answer!
Final Answer:
The table does show a probability distribution. All probabilities are between 0 and 1, is numerical, and the sum is .
Mean:
Standard deviation:
All requirements are satisfied, so the table is a valid probability distribution.
Q3. When playing roulette at a casino, a gambler is trying to decide whether to bet \frac{5}{38}\frac{33}{38}$ probability of losing $5.
Background
Topic: Expected Value in Probability
This question tests your ability to calculate expected value for a discrete random variable based on possible outcomes and their probabilities.
Key Terms and Formulas:
Expected Value:
Net profit: The amount won or lost for each outcome.
Probabilities: ,
Step-by-Step Guidance
Identify the possible outcomes: winning $30 or losing $5.
Write the expected value formula:
Calculate each term separately: and .
Add the two terms together to get the expected value, but stop before the final calculation.
Try solving on your own before revealing the answer!
Final Answer:
Expected value:
The expected value for the $5 bet that the outcome is any one of 00, 0, 1, 2, or 3 is approximately -$0.39.
Q4. Assume that when adults with smartphones are randomly selected, 64% use them in meetings or classes. If 7 adult smartphone users are randomly selected, find the probability that exactly 3 of them use their smartphones in meetings or classes.
Background
Topic: Binomial Probability
This question tests your ability to use the binomial probability formula to find the probability of a certain number of successes in a fixed number of trials.
Key Terms and Formulas:
Binomial Probability Formula:
(number of trials), (number of successes), (probability of success)
Step-by-Step Guidance
Identify the values: , ,
Set up the binomial formula:
Calculate , , and separately.
Multiply the terms together, but stop before the final calculation.
Try solving on your own before revealing the answer!
Final Answer:
The probability that exactly 3 out of 7 use their smartphones in meetings or classes is approximately 0.154.
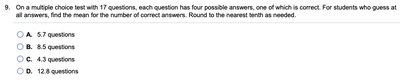
Q5. On a multiple choice test with 17 questions, each question has four possible answers, one of which is correct. For students who guess at all answers, find the mean for the number of correct answers. Round to the nearest tenth as needed.
Background
Topic: Binomial Distribution - Mean
This question tests your ability to find the expected number of successes in a binomial experiment.
Key Terms and Formulas:
Mean of Binomial Distribution:
(number of questions), (probability of guessing correctly)
Step-by-Step Guidance
Identify the values: ,
Set up the formula:
Multiply and , but stop before the final calculation.
Try solving on your own before revealing the answer!
Final Answer:
The mean number of correct answers is 4.3 (rounded to the nearest tenth).
Q6. Assume that a randomly selected subject is given a bone density test. Those test scores are normally distributed with a mean of 0 and a standard deviation of 1. Draw a graph and find the probability of a bone density test score greater than 0.69.
Background
Topic: Normal Distribution Probability
This question tests your ability to use the standard normal distribution to find probabilities for values greater than a given z-score.
Key Terms and Formulas:
Standard Normal Distribution: Mean , Standard deviation
Z-score:
Probability for :
Step-by-Step Guidance
Identify the z-score:
Use the standard normal table to find
Find the area to the right of , but stop before the final calculation.
Try solving on your own before revealing the answer!
Final Answer:
The probability of a bone density test score greater than 0.69 is approximately 0.2451.
