 Back
Backmar 16 Probability Rules and Applications in Statistics
Study Guide - Smart Notes
 Tailored notes based on your materials, expanded with key definitions, examples, and context.
mar 16 Probability: Foundations and Rules
Understanding Random Phenomena
Probability theory provides a mathematical framework for quantifying uncertainty in random phenomena. A random phenomenon is a situation where the possible outcomes are known, but the specific outcome of any trial is unpredictable. Each observation is called a trial, the result is an outcome, and a set of outcomes forms an event. The sample space is the collection of all possible outcomes.
Random phenomenon: Unpredictable outcome, but known possibilities.
Trial: Each repetition of the random process.
Outcome: Result of a single trial.
Event: Set of one or more outcomes.
Sample space (S): All possible outcomes.
The Law of Large Numbers (LLN)
The Law of Large Numbers states that as the number of trials increases, the proportion of times an event occurs approaches a single value, called the probability of the event. This is known as empirical probability. However, the LLN does not guarantee short-run regularity, and the so-called "Law of Averages" (that an outcome is "due" after many misses) is a misconception.
LLN: Long-run relative frequency stabilizes to the probability.
Empirical probability: Probability based on observed outcomes over many trials.
Law of Averages: Not a real law; past outcomes do not influence future independent trials.
Probability Rules
Basic Probability Model
Probabilities are assigned to events according to specific rules. The probability of any event is a number between 0 and 1, inclusive.
Probability Assignment Rule: For any event A, .
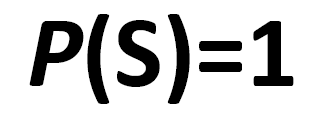
Total Probability Rule: The probability of the sample space is 1: .

The Complement Rule
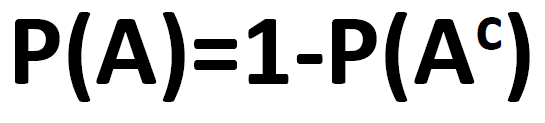
The complement of an event A, denoted , consists of all outcomes not in A. The probability of A is one minus the probability of its complement:
Complement Rule:

Addition Rule for Disjoint Events
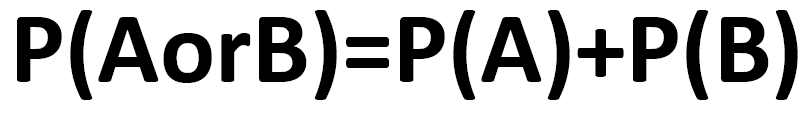
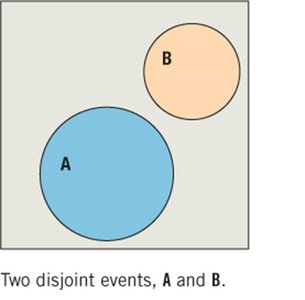
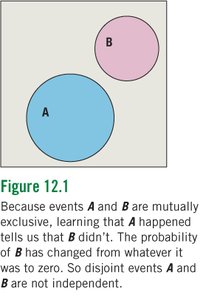
Events are disjoint (mutually exclusive) if they cannot occur together. For disjoint events A and B:
Addition Rule (Disjoint):
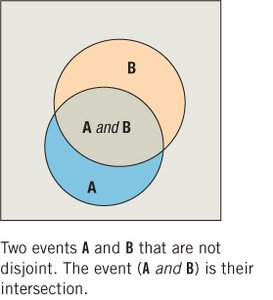
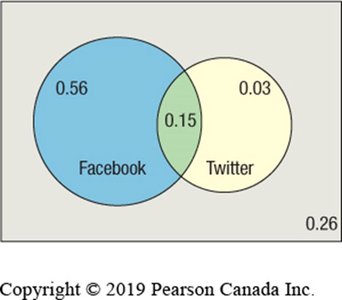
General Addition Rule
When events are not disjoint, the probability of their union is given by:
General Addition Rule:
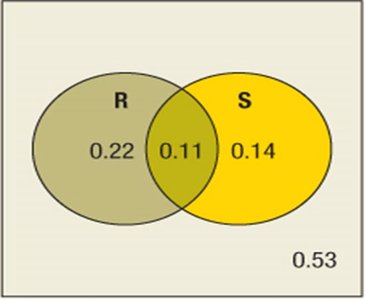
Example: University Students
Suppose 33% of students are in a relationship (R), 25% are involved in sports (S), and 11% are both. The probability that a student is in a relationship or involved in sports is:
Conditional Probability and Independence
Conditional Probability
Conditional probability quantifies the probability of event B occurring given that event A has occurred. It is denoted and calculated as:
(provided )
Conditional probability is essential for understanding how probabilities change when additional information is known.
Independence
Two events A and B are independent if the occurrence of one does not affect the probability of the other. Formally, A and B are independent if:
(or equivalently, )
Disjoint events cannot be independent, because knowing one occurred means the other did not.
Multiplication Rule
General Multiplication Rule:
Multiplication Rule for Independent Events:
Visualizing Probability
Contingency Tables
Contingency tables organize data to show the frequency or probability of combinations of events. They are useful for calculating marginal, joint, and conditional probabilities.
Venn Diagrams
Venn diagrams visually represent relationships between events, including intersections (and), unions (or), and complements.
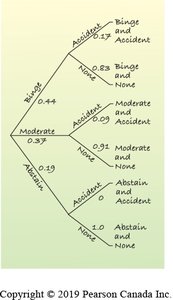
Tree Diagrams
Tree diagrams illustrate sequences of events and their probabilities, especially useful for conditional probabilities and the multiplication rule. Probabilities along branches are multiplied to find joint probabilities.
Summary Table: Key Probability Rules
Rule | Formula (LaTeX) | Description |
|---|---|---|
Probability Assignment | Probability is between 0 and 1 | |
Total Probability | Sum of all probabilities is 1 | |
Complement | Probability of event is 1 minus probability of its complement | |
Addition (Disjoint) | For disjoint events | |
General Addition | For any events | |
Conditional Probability | Probability of B given A | |
Multiplication (General) | Joint probability | |
Multiplication (Independent) | For independent events |
Common Pitfalls
Probabilities must sum to 1 for all possible outcomes.
Do not use the addition rule for disjoint events unless events are truly disjoint.
Disjoint events are not independent.
Do not confuse addition and multiplication rules.
Conclusion
Understanding and applying probability rules is fundamental for statistical reasoning. Mastery of these concepts enables accurate modeling of random phenomena, calculation of event probabilities, and critical evaluation of probabilistic claims.
