 Back
BackRandom Variables, Probability Distributions, and Binomial Distribution: Study Notes
Study Guide - Smart Notes
 Tailored notes based on your materials, expanded with key definitions, examples, and context.
Random Variables and Probability Distributions
Random Variables
A random variable is a variable whose value is determined by chance for each outcome of a procedure. It is typically denoted by x and can take on different numerical values depending on the outcome.
Discrete Random Variable: Takes on a finite or countable set of values (e.g., number of children, cars, items).
Continuous Random Variable: Can take on any value within a range, including decimals and fractions (e.g., age, weight, temperature).
Probability Distribution
A probability distribution lists all possible outcomes of a random variable and their corresponding probabilities. These probabilities can be determined theoretically or empirically, and the distribution can be represented as a table, graph, or formula.
Each probability value must be between 0 and 1 inclusive.
The sum of all probabilities must be 1.
Discrete Probability Distributions
Examples and Graphs
Discrete probability distributions are often illustrated using simple experiments such as tossing coins or observing the number of girls in two births.
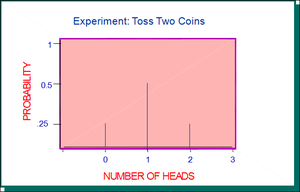
Example 1: Tossing two coins. The sample space consists of TT, TH, HT, HH, corresponding to 0, 1, or 2 heads.
Example 2: Number of girls in two births. The sample space consists of BB, GB, BG, GG, corresponding to 0, 1, or 2 girls.
Probability distributions for these examples can be shown as tables or histograms.
Probability Graph for Tossing Two Coins:
Probability Distribution Table
Tables are used to summarize the probability distribution for discrete random variables, such as the number of girls in two births.
Probability histograms visually represent the distribution, showing the probability for each possible outcome.
Formulas for Discrete Probability Distributions
Mean, Variance, and Standard Deviation
The mean (expected value), variance, and standard deviation are key parameters for describing a probability distribution.
Mean (Expected Value):
Variance:
Variance (shortcut):
Standard Deviation:
Expected Value
The expected value of a discrete random variable is the mean value of the outcomes, calculated as:
Identifying Unusual Results
Range Rule of Thumb
The range rule of thumb states that most values should lie within 2 standard deviations of the mean. Values outside this range are considered "unusual."
Maximum usual value:
Minimum usual value:
Binomial Probability Distribution
Definition and Requirements
A binomial probability distribution arises from a procedure that meets the following requirements:
Fixed number of trials (n).
Trials are independent.
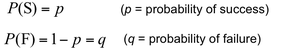
Each trial has two outcomes: success (S) or failure (F).
Probability of success (p) remains constant for each trial.
Notation
n: Number of trials
x: Number of successes in n trials
p: Probability of success in one trial
q: Probability of failure in one trial ()
P(x): Probability of getting exactly x successes
Binomial Probability Formula
The probability of getting exactly x successes in n trials is given by:
Parameters of Binomial Distribution
Mean:
Variance:
Standard Deviation:
Methods for Estimating Binomial Probabilities
Using the general formula
Using binomial probability tables
Using statistical software
Examples and Applications
Finding the probability that a certain number of people know of Twitter in a random sample.
Estimating the probability that a specific number of males smoke in a sample.
Calculating the mean, variance, and standard deviation for recognition rates in focus groups.
Applying the range rule of thumb to determine usual and unusual values in binomial contexts.
Summary Table: Binomial Distribution Parameters
Parameter | Formula |
|---|---|
Mean | |
Variance | |
Standard Deviation |
Practice Exercises
Calculate mean, variance, and standard deviation for the number of girls in two births.
Use the range rule of thumb to identify unusual results.
Apply the binomial probability formula to real-world scenarios (e.g., recognition rates, birth statistics).
Interpret binomial probability tables for sample problems.
Additional info: Academic context and formulas have been expanded for clarity and completeness. Images included are directly relevant to the explanation of probability distributions and binomial notation.
