 Back
BackLesson 6
Study Guide - Smart Notes
 Tailored notes based on your materials, expanded with key definitions, examples, and context.
Regression Analysis and Prediction
Definition and Purpose of Regression Line
The regression line is a straight line that models the relationship between an explanatory variable (x) and a response variable (y). It is used to predict the value of y for a given value of x, based on observed data.
Regression Equation:
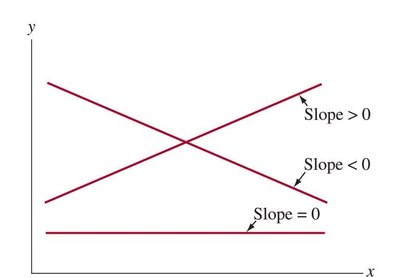
y-intercept (a): The predicted value of y when x = 0.
Slope (b): The change in predicted y for a one-unit increase in x.
Example: Predicting human height from femur length using where x is femur length in cm.
Least-Squares Regression Line
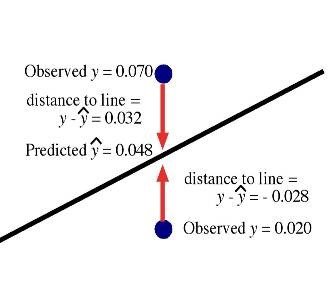
The least-squares regression line is the unique line that minimizes the sum of the squared vertical distances (residuals) between the observed data points and the line.
Residual: , the difference between observed and predicted values.
Sum of Squared Residuals:
The regression line always passes through the point of means .
Formulas:
Slope:
Intercept:
Where r is the correlation coefficient, and are the standard deviations of y and x, and and are their means.
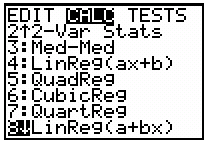
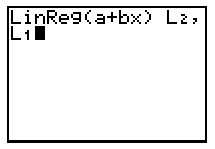
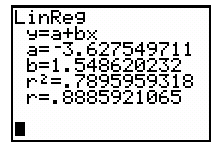
Using Technology for Regression
Statistical calculators and software can compute regression lines efficiently. Data are entered into lists (e.g., L1 for x, L2 for y), and regression functions output the slope, intercept, and correlation.
Correlation and Coefficient of Determination
Correlation (r)
Correlation measures the strength and direction of the linear relationship between two quantitative variables. It ranges from -1 (perfect negative) to +1 (perfect positive).
Does not depend on units of measurement.
Does not distinguish between explanatory and response variables.
Coefficient of Determination ()
The coefficient of determination, , represents the proportion of the variance in y that is explained by x using the regression model.
means all variation in y is explained by x.
means none of the variation in y is explained by x.
Example: If , then , meaning 76% of the variation in y is explained by x.
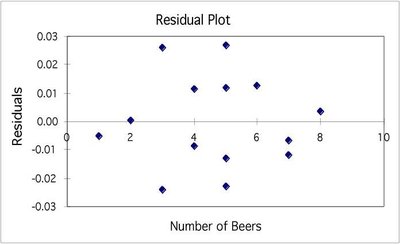
Residuals and Model Assessment
Understanding Residuals
Residuals are the differences between observed and predicted values. Analyzing residuals helps assess the fit of the regression model.
Random scatter of residuals around zero suggests a good linear fit.
Patterns in residuals indicate non-linearity or other issues.
Cautions in Regression and Correlation Analysis
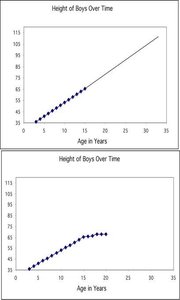
Extrapolation
Extrapolation is using a regression line to predict y for x-values outside the observed range. This is risky because the relationship may not hold beyond the data range.
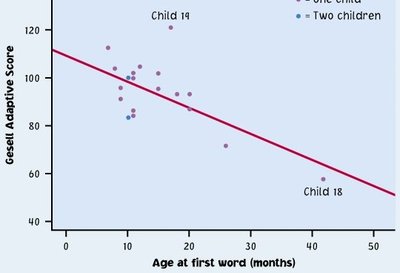
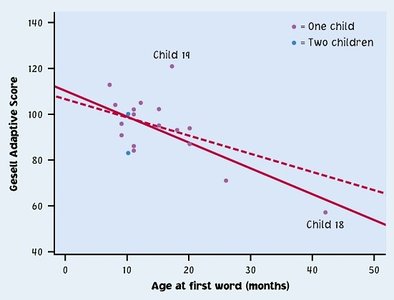
Outliers and Influential Observations
Outliers are points that deviate markedly from the overall pattern. Influential points are outliers in the x-direction that can significantly affect the regression line.
Correlation Does Not Imply Causation
A strong correlation between x and y does not mean that x causes y. There may be other variables (lurking variables) influencing both.
Lurking Variables and Confounding
Lurking variables are unmeasured variables that affect the association between x and y. Confounding occurs when two explanatory variables are both associated with the response and with each other.
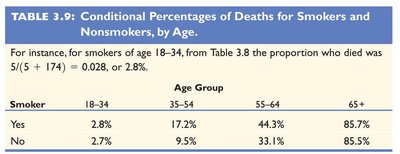
Simpson’s Paradox
Simpson’s Paradox occurs when the direction of an association between two variables reverses after accounting for a third variable.
Summary
The regression line describes the linear relationship between two quantitative variables and allows for prediction.
The coefficient of determination () quantifies the proportion of variation in y explained by x.
Be cautious of outliers, influential points, extrapolation, and lurking variables.
Correlation does not imply causation, and associations can be misleading if not properly analyzed.
