 Back
BackRegression Line, Scatter Plot, and Prediction for Baseball Pitchers
Study Guide - Smart Notes
 Tailored notes based on your materials, expanded with key definitions, examples, and context.
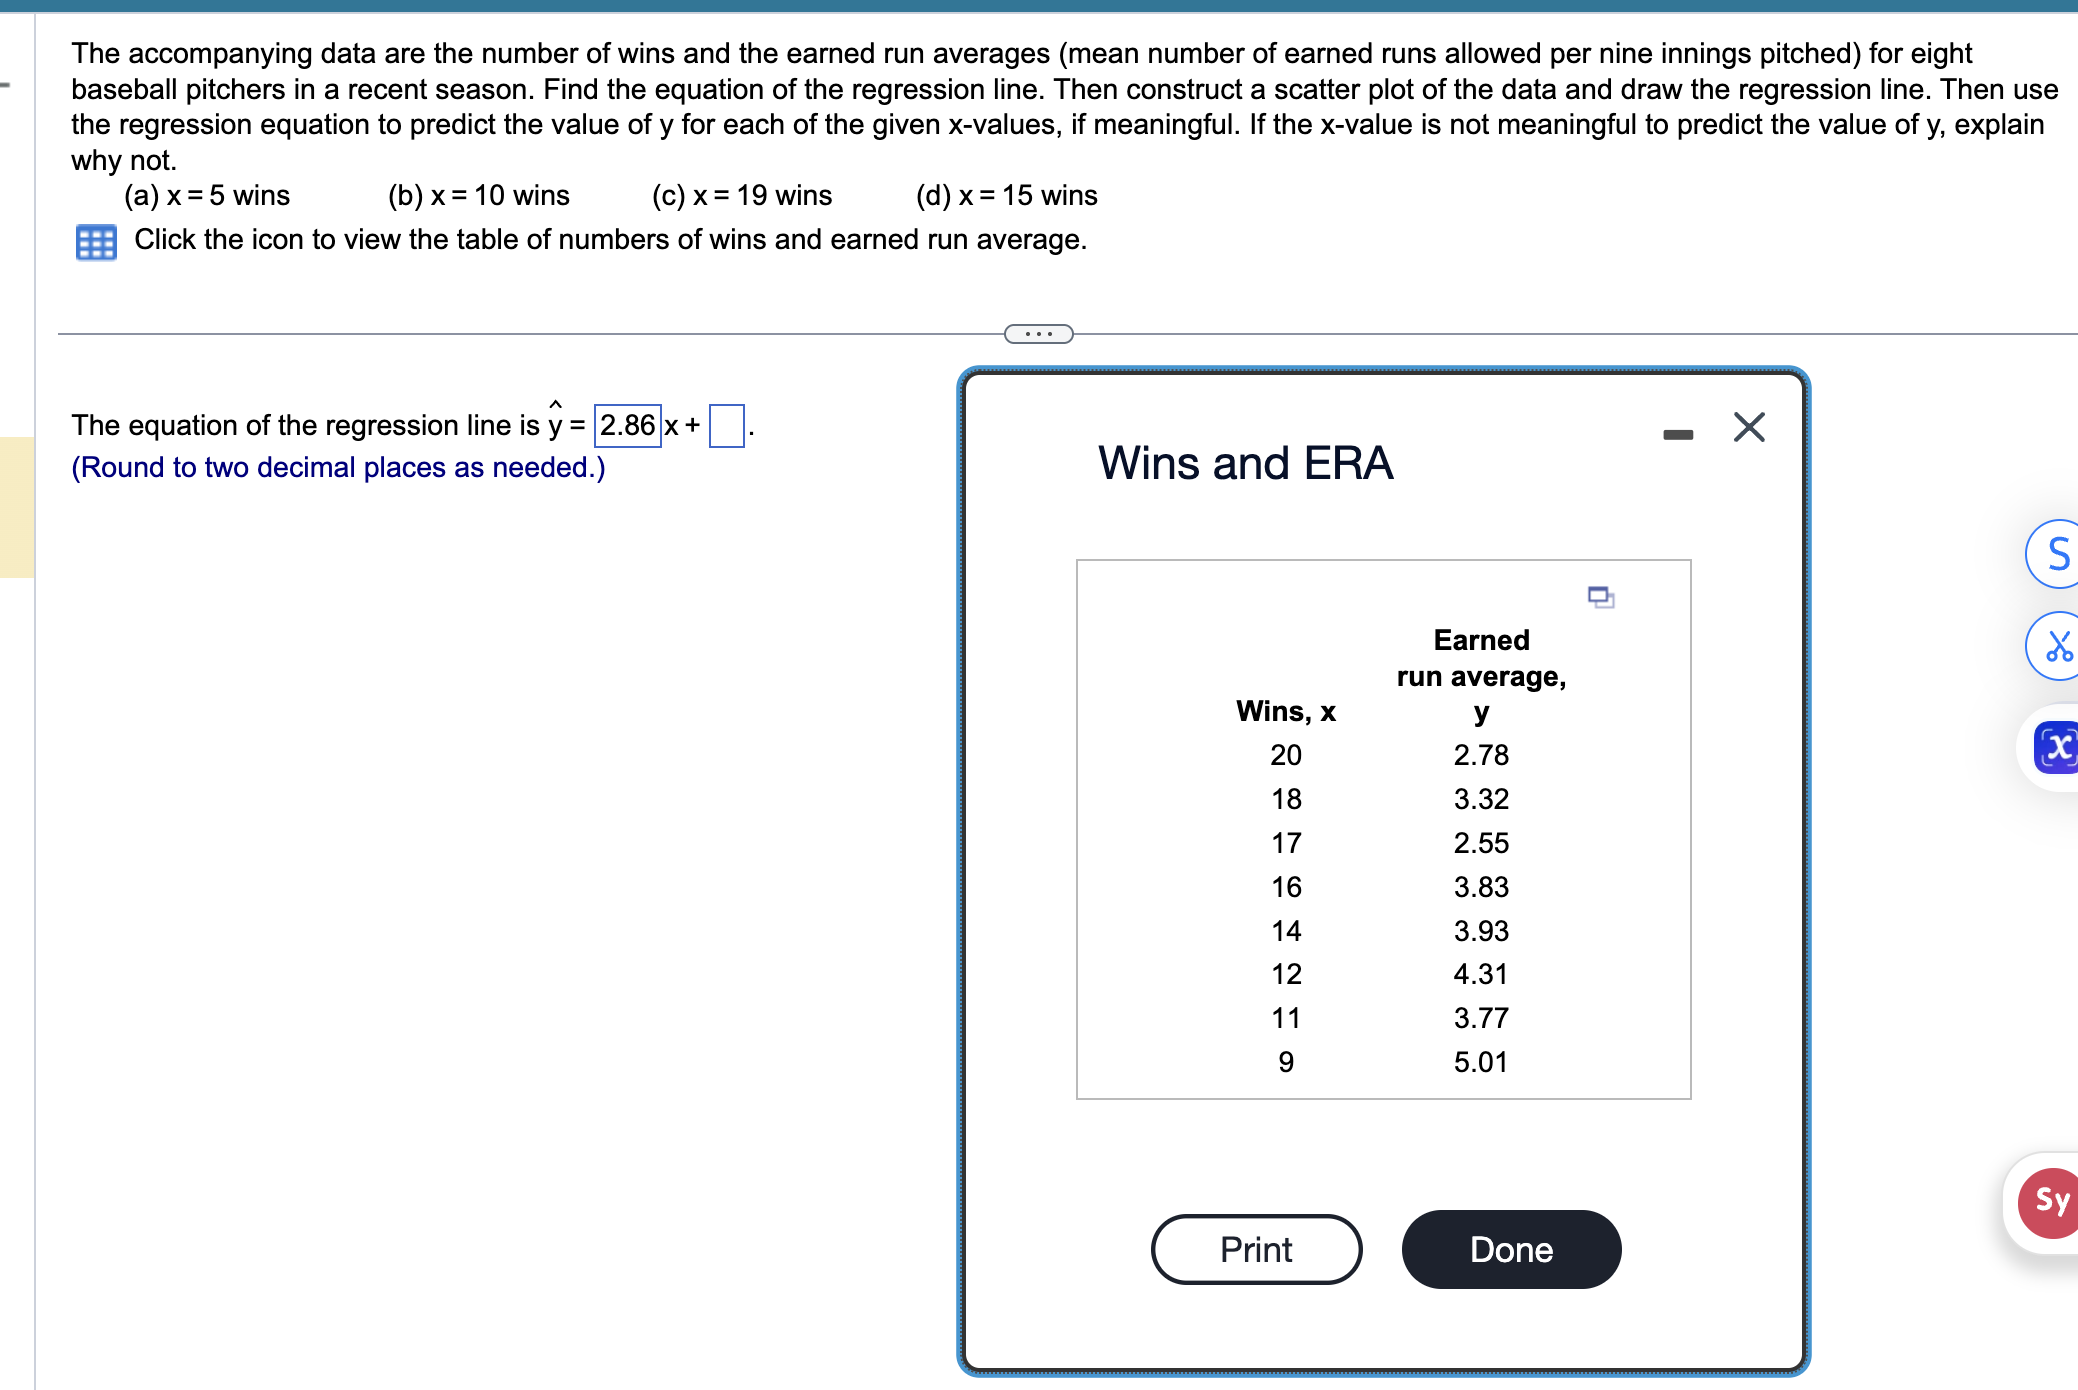
Q1. Find the equation of the regression line for the given data, construct a scatter plot, draw the regression line, and use the regression equation to predict the earned run average (y) for each given number of wins (x): (a) x = 5, (b) x = 10, (c) x = 19, (d) x = 15. If a prediction is not meaningful, explain why.
Background
Topic: Simple Linear Regression and Prediction
This question tests your understanding of how to find and interpret the regression line for bivariate data, create a scatter plot, and use the regression equation for prediction. It also asks you to consider the appropriateness of predictions for values outside the observed data range (extrapolation).
Key Terms and Formulas
Regression Line: The best-fit straight line through a set of bivariate data, used to model the relationship between two variables.
Equation of the Regression Line: where is the slope and is the y-intercept.
Prediction: Using the regression equation to estimate the value of for a given .
Extrapolation: Predicting for -values outside the range of the observed data, which may not be reliable.
Given Data
Wins, x | Earned Run Average, y |
|---|---|
20 | 2.78 |
18 | 3.32 |
17 | 2.55 |
16 | 3.83 |
14 | 3.93 |
12 | 4.31 |
11 | 3.77 |
9 | 5.01 |
Step-by-Step Guidance
Write the general form of the regression equation: .
Identify the slope () and y-intercept () from the regression output or calculation. The slope is given as (rounded to two decimal places). You need to find the y-intercept ($b_0$) using the data or regression formula.
To construct the scatter plot, plot each pair from the table on a coordinate plane. Draw the regression line using the equation once both and are known.
For prediction, substitute each given -value into the regression equation to estimate :
For (a)
For (b)
For (c)
For (d)
Calculate for each, but consider whether the -value is within the range of the observed data (9 to 20 wins). If not, explain why the prediction may not be meaningful (extrapolation).
Set up the substitution for each -value, but do not compute the final values yet.
Try solving on your own before revealing the answer!
Final Answer:
The regression equation is , where (the y-intercept) is calculated using the data. After finding $b_0$, substitute each -value to get the predicted :
(a) For :
(b) For :
(c) For :
(d) For :
Remember, predictions for -values outside the observed range (9 to 20) are extrapolations and may not be reliable.
