 Back
BackRegression, $R^2$, and Extrapolation: Key Concepts and Pitfalls
Study Guide - Smart Notes
 Tailored notes based on your materials, expanded with key definitions, examples, and context.
7.6 The Variation Accounted for by the Model ()
Understanding (Coefficient of Determination)
The coefficient of determination, , quantifies the proportion of the variance in the dependent variable that is predictable from the independent variable(s) using a regression model. It is a key measure of how well the regression line fits the data.
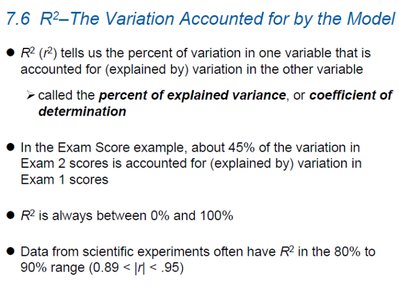
Definition: is the percent of variation in one variable explained by variation in the other variable. It is also called the percent of explained variance or coefficient of determination.
Formula: , where is the correlation coefficient.
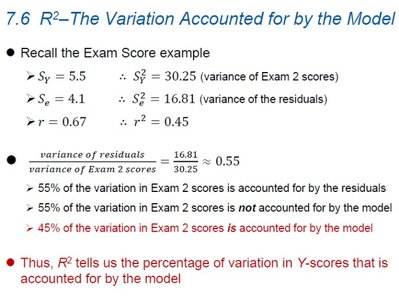
Interpretation: An of 0.45 means 45% of the variation in is explained by the model; the remaining 55% is unexplained (residual).
Range: is always between 0% and 100%.
Scientific Data: Experiments often yield high values (80–90%).
Observational Data: Lower values (30–50%) can still indicate useful regression, especially when measuring responses is difficult.
Reporting: Always report with regression results to allow assessment of model fit.
Example: Exam Score Regression
Given: , (variance of Exam 2 scores), , (variance of residuals), ,
Calculation:
Interpretation: 45% of the variation in Exam 2 scores is accounted for by the model.
Visualizing with Scatterplots
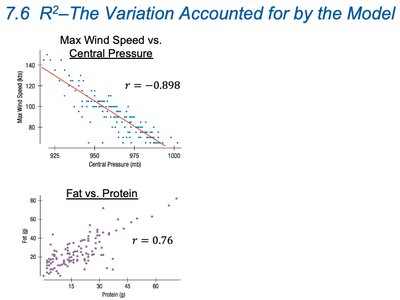
Scatterplots help visualize the strength of association and the fit of the regression line.
Examples: Max Wind Speed vs. Central Pressure (), Fat vs. Protein ()
7.7 Regression Assumptions & Conditions
Key Conditions for Linear Regression
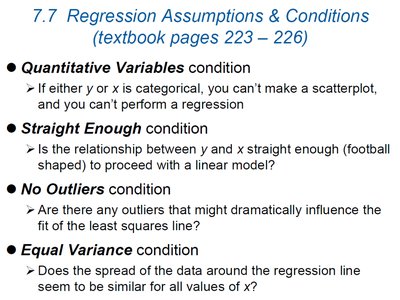
Before fitting a linear regression model, several assumptions must be checked to ensure the validity of the results:
Quantitative Variables: Both and must be quantitative. Regression is not appropriate for categorical variables.
Straight Enough: The relationship between and should be approximately linear (not curved or football-shaped).
No Outliers: Outliers can disproportionately affect the regression line and should be investigated.
Equal Variance (Homoscedasticity): The spread of residuals should be roughly constant for all values of .
Checking Regression Conditions: Example
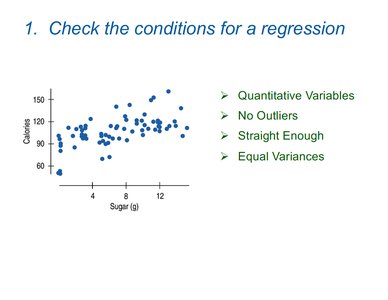
Scatterplot of Calories vs. Sugar in breakfast cereals is used to check conditions.
Checklist: Quantitative Variables, No Outliers, Straight Enough, Equal Variances
Fitting the Regression Model
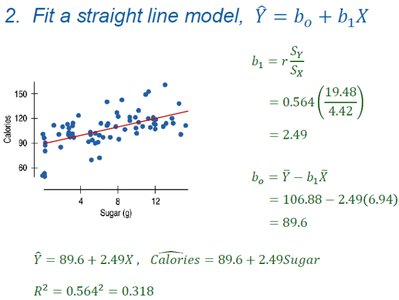
Regression equation:
Slope:
Intercept:
Example: Calories = Sugar
(31.8% of the variation in Calories is explained by Sugar)
Checking the Residuals
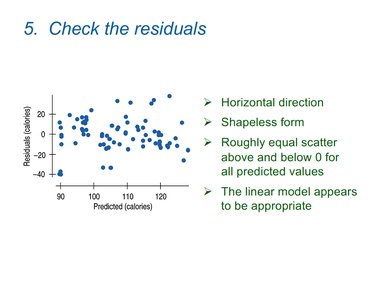
Residuals should be randomly scattered around zero with no clear pattern.
Horizontal direction and shapeless form indicate a good fit.
Example: Residual plot for Calories vs. Sugar shows appropriate linear model.
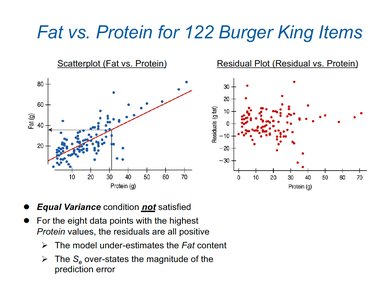
Equal Variance Condition: Example
Fat vs. Protein for Burger King items: Residual plot shows violation of equal variance condition for high Protein values.
Model underestimates Fat content for high Protein values; overstates prediction error magnitude.
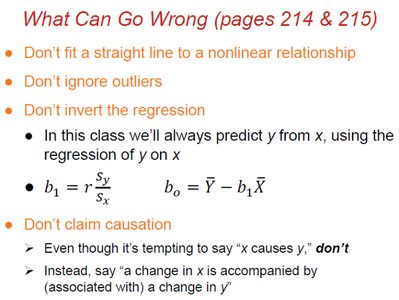
What Can Go Wrong in Regression
Nonlinear Relationships: Do not fit a straight line to a nonlinear relationship.
Outliers: Do not ignore outliers; they can distort the regression.
Regression Direction: Always predict from (not the other way around).
Causation: Do not claim causation from correlation; say "a change in is associated with a change in ."
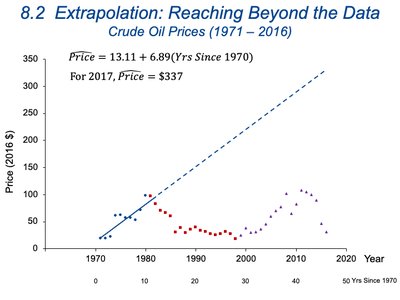
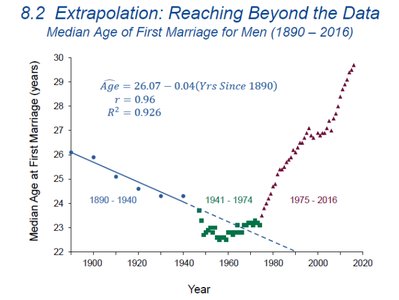
8.2 Extrapolation: Reaching Beyond the Data
Understanding Extrapolation
Extrapolation involves using a regression model to predict values outside the range of the observed data. This practice is risky because it assumes that the established relationship continues unchanged beyond the data.
Example: Predicting crude oil prices or median age at first marriage far into the future can lead to unrealistic results.
Key Point: Past trends may not continue; extrapolation can be misleading.
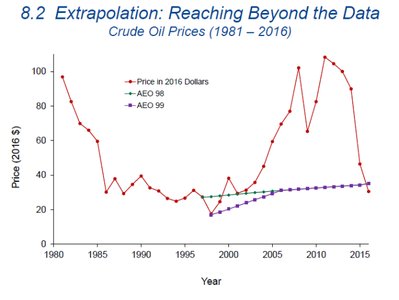
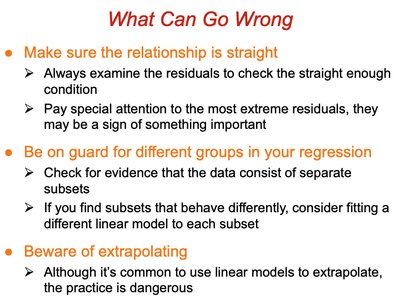
What Can Go Wrong with Extrapolation
Straight Enough: Always check residuals for linearity; extreme residuals may indicate problems.
Different Groups: If data contain distinct groups, fit separate models as needed.
Extrapolation Dangers: Extrapolating can produce unreliable and unrealistic predictions.
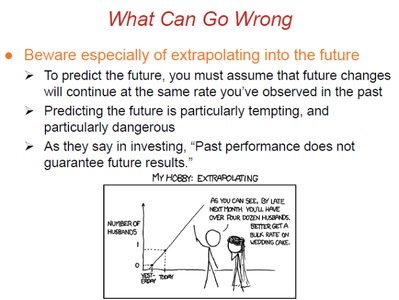
Future Predictions: Predicting the future assumes trends continue, which is often not the case. "Past performance does not guarantee future results."
Summary Table: Regression Assumptions and Pitfalls
Assumption/Practice | Explanation |
|---|---|
Quantitative Variables | Both variables must be quantitative for regression to be valid. |
Straight Enough | Relationship should be linear; check with scatterplot and residuals. |
No Outliers | Outliers can distort regression; investigate and address them. |
Equal Variance | Residuals should have constant spread across all values of . |
Extrapolation | Predictions outside data range are risky and often unreliable. |
Reporting | Always report to indicate model fit. |
Correlation vs. Causation | Association does not imply causation; avoid causal claims. |
