 Back
BackRegression Wisdom: Advanced Concepts in Linear Regression Analysis
Study Guide - Smart Notes
 Tailored notes based on your materials, expanded with key definitions, examples, and context.
Regression Wisdom
Examining Residuals
Residuals are the differences between observed and predicted values in a regression model. Examining residuals is crucial because linear regression only works well for linear relationships. Non-linearity or other issues may not be obvious in a scatterplot of the original data but can become apparent in residual plots.
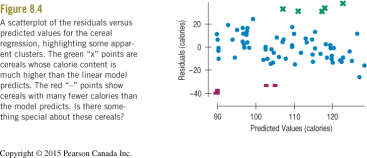
Residual Plot: A scatterplot of residuals versus predicted values helps reveal non-linearity, outliers, or patterns not visible in the original data.
Histogram of Residuals: A histogram or probability plot of residuals can show the distribution and highlight the presence of multiple modes or subgroups.
Checking Model Appropriateness: Always plot and examine residuals to check if the linear model is reasonable.

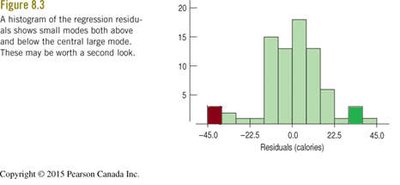
Sifting Residuals for Groups
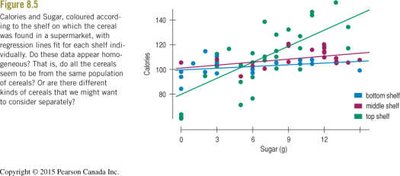
Residual analysis can reveal subgroups or clusters within the data that may not be apparent in the original scatterplot. These subgroups may indicate that the data come from different populations, suggesting the need for separate models.
Multiple Modes: The presence of multiple modes in the residuals may indicate different subgroups.
Analyzing Subsets: If subgroups are found, consider fitting separate regression models for each group.
Model Usefulness: Even if the model is not perfect, it can still provide useful insights about the data.
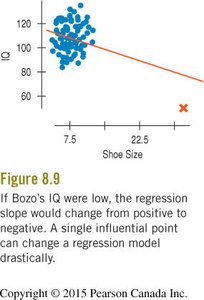
Outliers, Leverage, and Influence
Outliers and points with high leverage or influence can have a significant impact on regression models. Understanding their effects is essential for accurate modeling and interpretation.
Outliers: Points that stand away from the others in either the x- or y-direction. They can strongly influence the regression line and should be examined carefully.
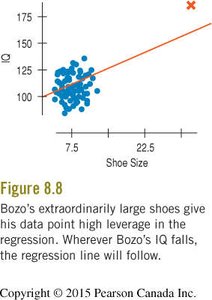
Leverage: Points with extreme x-values (far from the mean of x) have high leverage and can pull the regression line toward themselves.
Influence: A point is influential if removing it changes the regression model significantly. High-leverage points can have high or low influence depending on their y-value.
Model Comparison: Compare regression models with and without unusual points to assess their influence.


Extrapolation: Reaching Beyond the Data
Extrapolation refers to using a regression model to predict values outside the range of the observed data. This practice is risky because the relationship between variables may change beyond the observed range.
Definition: Extrapolation is predicting y for x-values outside the range of the data used to fit the model.
Risks: Extrapolations require the assumption that the relationship remains unchanged, which is often not justified.
Example: Using a regression model based on data from 1900–1940 to predict the median age at first marriage in 2000 led to a large error because the trend changed over time.
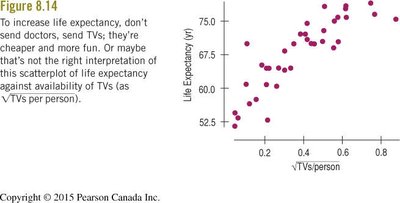
Lurking Variables and Causation
Regression analysis can reveal associations but cannot establish causation. Lurking variables—unobserved factors that influence both variables—can create misleading associations.
Lurking Variable: A variable not included in the analysis that affects both the explanatory and response variables.
Observational Data: With observational data, it is impossible to rule out the influence of lurking variables.
Examples: Life expectancy is associated with both the number of doctors and the number of TVs per person, but the true cause may be a higher standard of living.

Predicting Changes in the Response Variable
Regression coefficients describe the relationship in the observed data but should not be interpreted as predictions of how y would change if x were manipulated. Regression models are descriptive, not necessarily predictive for interventions.
Descriptive Nature: Regression describes the association in the data, not the effect of changing x.
Limitations: Do not use regression to predict far from the observed x-values or to infer causality.
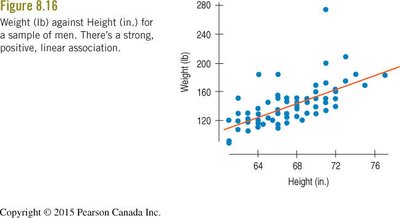
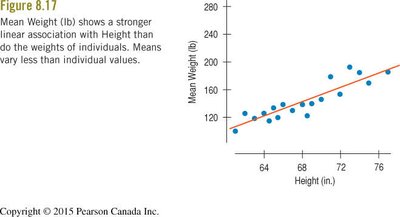
Working With Summary Values
When data are summarized (e.g., means for groups), scatterplots tend to show less variability and stronger associations than plots of individual data. This can give a misleading impression of the strength of the relationship.
Summary Statistics: Means and other summary statistics vary less than individual data points.
Inflated Associations: Regression lines fit to summary data often appear stronger than those fit to individual data.
Irreversibility: Once data are summarized, the original variability cannot be recovered.
What Can Go Wrong?
Several pitfalls can undermine regression analysis. Being aware of these issues helps ensure valid and meaningful results.
Straight Enough Condition: Ensure the relationship is linear before fitting a linear model.
Subgroups: Watch for different groups in the data; fit separate models if necessary.
Extrapolation: Avoid making predictions outside the range of the data.
Unusual Points: Investigate outliers, high-leverage, and influential points; compare models with and without them.
Lurking Variables: Do not infer causation from association; consider possible lurking variables.
Summary Data: Be cautious when interpreting regressions based on summarized data.
Range Restriction: Restricting the range of variables can weaken observed associations.
What Have We Learned?
Effective regression analysis requires skepticism, careful examination of residuals, and awareness of potential violations of assumptions. Always interpret regression results in context, considering possible subgroups, outliers, lurking variables, and the limitations of summary data.
Diagnose Nonlinearity: If the relationship is not straight, consider re-expressing variables (e.g., using powers, roots, or logarithms).
Appropriate Interpretation: Do not infer causation or make predictions far from the data.
Summary Data Caution: Recognize that regressions with summary data may overstate the strength of relationships.
