 Back
Review of Confidence Intervals and Basic Statistical Inference
Study Guide - Smart Notes
 Tailored notes based on your materials, expanded with key definitions, examples, and context.
Review of Basic Statistics
Why Learn Statistics?
Statistics is the discipline that transforms raw information into meaningful insights, enabling informed decision-making and action. It is foundational for understanding data in various fields, from science to business.
Descriptive Statistics: Summarizes and describes the main features of a dataset.
Graphical Summaries: Common visualizations include pie charts, bar graphs, histograms, and scatterplots.
Numerical Summaries: Key measures include:
Measures of Central Tendency: Mean, median, and mode.
Measures of Dispersion: Range, variance, and standard deviation.
Statistical Inference
Introduction to Statistical Inference
Statistical inference involves using sample data (statistics) to make conclusions about a larger population (parameters). This process is essential for making predictions and testing hypotheses.
Population: The entire group of interest.
Sample: A subset of the population used for analysis.
Parameter: A numerical summary of a population.
Statistic/Estimate: A numerical summary of a sample.
Sampling Designs: Includes simple random sampling and stratified random sampling.
Observational Studies vs. Randomized Controlled Experiments: Observational studies observe without intervention, while experiments assign treatments to study effects.
Association is not causation: Correlation does not imply a causal relationship.
Treatment Group vs. Control Group: Used in experiments to compare outcomes.
Sampling Distributions & Confidence Intervals
Distribution of Sample Proportion
For a simple random sample of size n with population proportion p, the sampling distribution of the sample proportion \( \hat{p} \) is approximately normal if certain conditions are met.
Shape: Approximately normal if \( np(1-p) \geq 10 \).
Mean: \( \mu_{\hat{p}} = p \)
Standard Deviation: \( \sigma_{\hat{p}} = \sqrt{\frac{p(1-p)}{n}} \)
Distribution of Sample Mean
The sampling distribution of the sample mean \( \bar{x} \) depends on the population distribution and sample size.
If the population is normal: The sample mean is normally distributed for any sample size.
If the population is not normal: The sample mean becomes approximately normal as the sample size increases (Central Limit Theorem).
Mean: \( \mu_{\bar{x}} = \mu \)
Standard Deviation: \( \sigma_{\bar{x}} = \frac{\sigma}{\sqrt{n}} \)
Point Estimates and Confidence Intervals
Key Concepts
Point Estimate: A single value estimate of a population parameter (e.g., sample mean \( \bar{x} \)).
Confidence Interval (CI): A range of values, derived from the sample, that is likely to contain the population parameter.
Level of Confidence: The probability that the CI contains the true parameter (commonly 95%).
Margin of Error: The maximum expected difference between the true parameter and a sample estimate.
Critical Value: The value from the standard normal (z) or t-distribution corresponding to the desired confidence level.
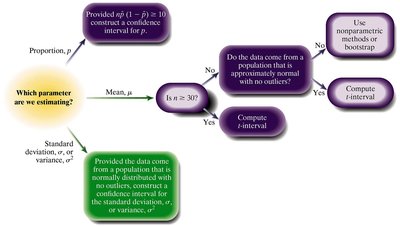
Choosing the Appropriate Confidence Interval
The type of confidence interval depends on the variable of interest and the data type.
Population Proportion: Use when data are qualitative with two possible outcomes (e.g., Yes/No).
Population Mean: Use when data are quantitative and summarized by mean and standard deviation.
Conditions for Constructing Confidence Intervals
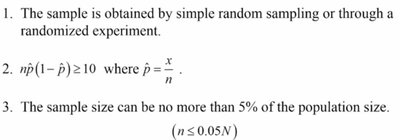
For a Population Proportion
The sample is obtained by simple random sampling or a randomized experiment.
\( np(1-\hat{p}) \geq 10 \), where \( \hat{p} = \frac{x}{n} \).
The sample size is no more than 5% of the population size (\( n \leq 0.05N \)).
For a Population Mean
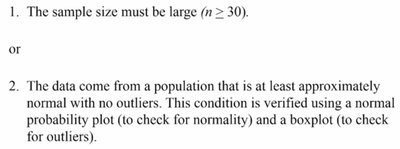
The sample must be obtained by simple random sampling or a randomized experiment, and \( n \leq 0.05N \).
Either:
The sample size is large (\( n \geq 30 \)), or
The data come from a population that is at least approximately normal with no outliers (verified using a normal probability plot and a boxplot).
Formulas for Confidence Intervals
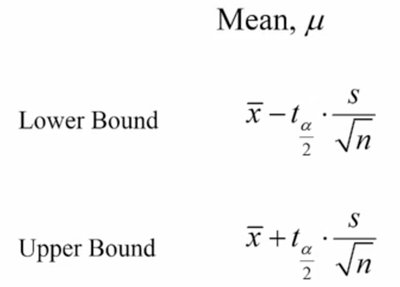
For a Population Mean (\( \mu \))
Lower Bound:
Upper Bound:
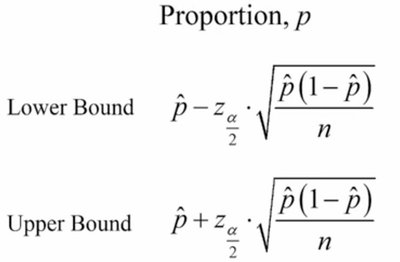
For a Population Proportion (\( p \))
Lower Bound:
Upper Bound:
Examples and Applications
Example: Constructing a Confidence Interval for a Mean
Suppose Robert wishes to estimate the mean number of miles his car can be driven on a full tank of gas. He collects a random sample of 10 measurements:
Sample mean (\( \bar{x} \)): 380.67
Sample standard deviation (s): 42.47
Sample size (n): 10
To construct a 95% confidence interval, verify normality and absence of outliers using a boxplot and a normal probability plot.
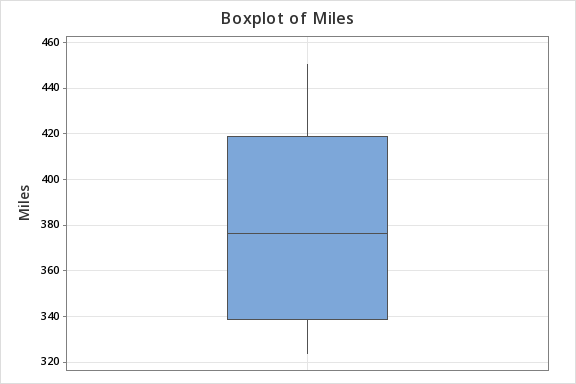
The boxplot shows no outliers, supporting the assumption of normality.
Using the t-distribution with 9 degrees of freedom (n-1), the critical value \( t_{0.025} = 2.262 \).
Lower Bound:
Upper Bound:
Interpretation: We are 95% confident that the population mean miles driven on a full tank of gas is between 350.29 and 411.05.

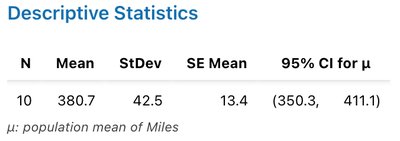
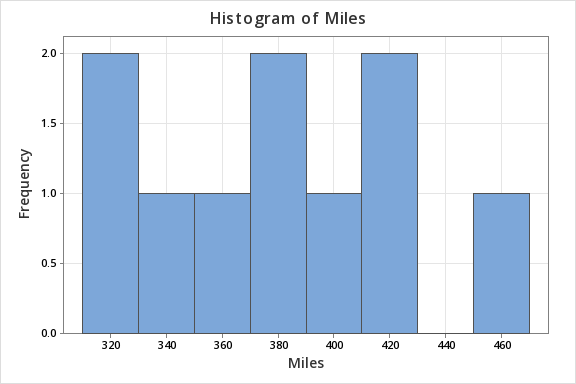
Summary Table: Descriptive Statistics for Miles Driven
Variable | N | Mean | SE Mean | StDev | Minimum | Q1 | Median | Q3 | Maximum |
|---|---|---|---|---|---|---|---|---|---|
Miles | 10 | 380.67 | 13.43 | 42.47 | 323.9 | 339.025 | 376.65 | 419.075 | 450.7 |
Practice: Identifying the Appropriate Confidence Interval
Quantitative variable (e.g., time spent studying): Use a confidence interval for the mean.
Qualitative variable with two outcomes (e.g., Yes/No): Use a confidence interval for the proportion.
Additional info: The examples provided reinforce the importance of matching the confidence interval method to the type of variable and data collected.
