 Back
BackSampling Distribution Models and Confidence Intervals for Proportions
Study Guide - Smart Notes
 Tailored notes based on your materials, expanded with key definitions, examples, and context.
Sampling Distribution Models and Confidence Intervals for Proportions
Introduction to Sampling Distributions
Sampling distributions describe the probability distribution of a statistic (such as a sample proportion) based on repeated random samples from a population. Understanding these distributions is essential for making statistical inferences about population parameters.
Sampling Distribution: The distribution of a statistic (e.g., sample proportion) over many samples.
Sample Proportion (\( \hat{p} \)): The proportion of successes in a sample.
Population Proportion (\( p \)): The true proportion of successes in the population.
Standard Error: The standard deviation of the sampling distribution.
When Does the Normal Model Work?
The normal model can be used to approximate the sampling distribution of sample proportions under certain assumptions and conditions. These ensure the distribution is approximately normal, allowing for inference using z-scores and confidence intervals.
Independence Assumption: Data must be collected so that each observation is independent.
Randomization Condition: Data should come from a random sample or subjects should be randomly assigned to treatments.
10% Condition: The sample size \( n \) should be less than 10% of the population size \( N \):
Success/Failure Condition: The sample size must be large enough so that both expected successes and failures are at least 10:
Sample Size and Variability
Sample size affects the variability of the sampling distribution. Larger samples yield less variability, making the sample proportion a more reliable estimate of the population proportion.
Standard Error Formula:
Effect of Sample Size: Increasing sample size decreases the standard error.
Distribution Shape: If conditions are met, the sampling distribution is approximately normal (bell-shaped).

Examples of Sampling Distribution for Proportions
Several examples illustrate how to check conditions and calculate the mean and standard deviation of the sampling distribution for sample proportions.
Blue M&M's Example: If 24% of M&M's are blue and a random sample of 100 is taken: Probability Calculation: Probability of less than 20% blue M&M's:
Effect of Larger Sample: For a sample of 400, the mean stays the same but the standard error decreases:
Application: BMI Example
Suppose 22% of college students have a BMI > 30. In a random sample of 200 students, 31 have BMI > 30. Is this unusually small?
Sample Proportion:
Population Proportion:
Standard Error:
z-score:
Interpretation: Values 2 SD below the mean occur less than 2.5% of the time, suggesting the sample proportion is unusually small.
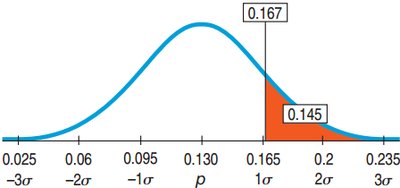
Application: Left-Handed Students Example
13% of the population is left-handed. In a class of 90 students, what is the probability that more than 16.7% are left-handed (i.e., more than 15 students)?
Sample Proportion:
Population Proportion:
Standard Error:
Probability:
Conclusion: There is about a 14.5% chance that there will not be enough seats for left-handed students.
Limitations of the Normal Model
The normal model is not always appropriate for all statistics or under all conditions. It works well for sample proportions and means when assumptions are met, but not for statistics like minimum, maximum, median, or variance. Simulation methods may be needed when the population distribution is unknown or when samples are dependent.
Central Limit Theorem (CLT): Provides the foundation for using the normal model for proportions and means.
Dependent Samples: The CLT fails for dependent samples; independence is crucial.
Simulation: Useful for estimating sampling distributions when the normal model does not apply.
Common Pitfalls
It is important not to confuse the sampling distribution with the distribution of the sample itself. Always check assumptions and conditions before applying the normal model.
Sampling Distribution vs. Sample Distribution: The sampling distribution refers to the distribution of a statistic over many samples, not the distribution of values within a single sample.
Independence: Observations must be independent for the normal model and CLT to apply.
