 Back
BackSampling Distribution Models and Confidence Intervals for Proportions
Study Guide - Smart Notes
 Tailored notes based on your materials, expanded with key definitions, examples, and context.
Chapter 13: Sampling Distribution Models and Confidence Intervals for Proportions
Introduction to Sampling Distributions and Confidence Intervals
In inferential statistics, we use sample data to estimate population parameters. Rather than relying on a single value, we provide a range of plausible values—known as a confidence interval—to express our uncertainty about the true parameter value.
Population Parameters and Sample Statistics
Parameter: A numerical summary of a population (e.g., population proportion p).
Statistic: A numerical summary calculated from a sample (e.g., sample proportion \hat{p}).
Statistical Inference: The process of drawing conclusions about a population based on sample data.
Confidence Intervals for Proportions
A confidence interval (CI) for a population proportion provides a range of plausible values for the parameter, based on the sample statistic and the margin of error.
General form: Statistic ± Margin of Error
Margin of Error: Reflects sampling variability and the confidence that the interval captures the parameter.
For a proportion, the CI is:
where is the standard error of the sample proportion.
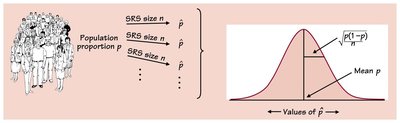
Standard Error for a Proportion
The standard error (SE) estimates the standard deviation of the sampling distribution of the sample proportion. Since the population proportion p is usually unknown, we use the sample proportion \hat{p}:
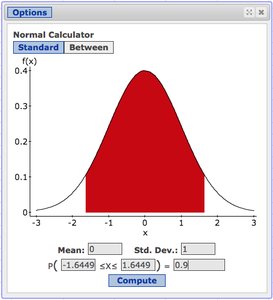
Critical Values and Confidence Levels
The critical value depends on the desired confidence level (C). It represents the number of standard errors to extend from the sample statistic to capture the central C% of the normal distribution.
Confidence Level (C) | Critical Value () |
|---|---|
90% | 1.645 |
95% | 1.960 (≈2) |
99% | 2.576 |
99.9% | 3.291 |
To find , use a normal probability table, calculator, or statistical software.
Assumptions and Conditions for Constructing a Confidence Interval
Before constructing a confidence interval for a proportion, check these conditions:
Independence Assumption: Data should be collected using a simple random sample (SRS) or randomized experiment.
10% Condition: Sample size should be less than 10% of the population size ().
Success/Failure Condition: There must be at least 10 expected successes and 10 expected failures in the sample: and .
One-Proportion Z-Interval
If the above conditions are satisfied, the confidence interval for a population proportion is:
where and is the critical value for the desired confidence level.
Naming the Confidence Interval
One-proportion z-interval: "One" for one population, "proportion" for the categorical variable, "z" for the normal approximation, and "interval" for the range of plausible values.
Interpreting Confidence Intervals
Correct interpretation involves three steps:
State the level of confidence (e.g., 95%).
State the parameter of interest (e.g., the proportion of all townspeople who agree with school redistricting).
State the confidence interval (e.g., between 0.632 and 0.788).
Example: "I am 95% confident that the interval from 0.632 to 0.788 captures the true proportion of all townspeople who agree with school redistricting."
Common Misinterpretations
It is incorrect to say there is a 95% probability that the true proportion is in the interval. The parameter is fixed; the interval is random.
It is incorrect to say that other samples will have proportions in the interval. Each sample yields its own interval.
The confidence interval is about the parameter, not the sample statistic.
Worked Example
Suppose a random sample of 131 townspeople yields 93 who agree with school redistricting. Calculate the 95% confidence interval for the true proportion:
Sample proportion:
Standard error:
Critical value for 95%:
Confidence interval:
Interpretation: "I am 95% confident that between 63.2% and 78.8% of all townspeople agree with school redistricting."
Summary Table: Steps for Constructing a Confidence Interval for a Proportion
Step | Description |
|---|---|
1 | Check assumptions and conditions (independence, 10%, success/failure) |
2 | Calculate sample proportion |
3 | Compute standard error |
4 | Find critical value for desired confidence level |
5 | Construct interval: |
6 | Interpret the interval in context |
What You Cannot Say About the Interval
Do not claim the interval contains the sample statistic with a certain probability.
Do not claim the parameter varies; it is fixed, but unknown.
Do not claim the interval applies to other samples.
