 Back
BackSampling Distribution Models and Confidence Intervals for Proportions
Study Guide - Smart Notes
 Tailored notes based on your materials, expanded with key definitions, examples, and context.
Sampling Distribution Models and Confidence Intervals for Proportions
Introduction to Sampling Distributions
Sampling distributions describe the behavior of sample statistics over repeated sampling from the same population. In the context of proportions, we are often interested in the distribution of the sample proportion, denoted as \( \hat{p} \), when many samples of the same size are drawn from a population with true proportion p.
Sample Proportion (\( \hat{p} \)): The proportion of successes in a sample of size n.
Population Proportion (p): The true proportion of successes in the entire population.
Each sample yields a different \( \hat{p} \), leading to a distribution of sample proportions.
Example: If we repeatedly survey 100 people about Facebook usage, each sample will yield a slightly different proportion of users.
Confidence Intervals for Proportions
A confidence interval provides a range of plausible values for a population parameter (such as p) based on sample data. For proportions, the confidence interval is typically constructed as:
\( \hat{p} \): Sample proportion
\( z^* \): Critical value from the standard normal distribution for the desired confidence level (e.g., 1.96 for 95%)
\( SE(\hat{p}) \): Standard error of the sample proportion, calculated as
Example: In a survey of 1520 U.S. adults, 68% reported using Facebook. The 95% confidence interval is 0.656 to 0.704, meaning we are 95% confident that the true proportion of U.S. adults who use Facebook is between 65.6% and 70.4%.
Interpreting Confidence Intervals
It is crucial to interpret confidence intervals correctly. A 95% confidence interval means that if we were to take many random samples and compute a confidence interval from each, about 95% of those intervals would contain the true population proportion p. It does not mean that 95% of individuals fall within the interval, nor does it guarantee that the specific interval calculated from our sample contains p—we can only be confident in the long-run performance of the method.
Correct Interpretation: "We are 95% confident that the interval from 65.6% to 70.4% captures the true proportion of U.S. adults who use Facebook."
Incorrect Interpretation: "95% of individuals will be between x and y." (This is wrong; the interval refers to the parameter, not individuals.)
Visualizing Confidence Intervals and Coverage
When we repeat the sampling process many times, each sample yields a different confidence interval. Some intervals will contain the true parameter p, while others will not. For a 95% confidence level, about 95% of the intervals will capture p, and about 5% will miss it.
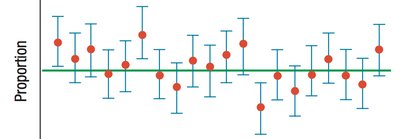
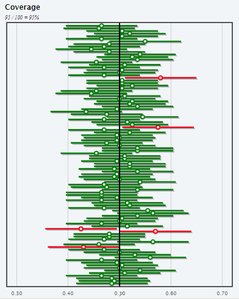
Additional info: These images illustrate the concept of repeated sampling and the proportion of intervals that successfully capture the true population parameter.
Summary Table: Confidence Interval Concepts
Term | Definition | Formula |
|---|---|---|
Sample Proportion (\( \hat{p} \)) | Proportion of successes in the sample | |
Standard Error (SE) | Estimated standard deviation of \( \hat{p} \) | |
Confidence Interval | Range of plausible values for p | |
Confidence Level | Proportion of intervals that capture p in the long run | e.g., 95% |
