 Back
BackSampling Distribution Models and Confidence Intervals for Proportions
Study Guide - Smart Notes
 Tailored notes based on your materials, expanded with key definitions, examples, and context.
Sampling Distribution Models and Confidence Intervals for Proportions
Certainty vs. Precision in Confidence Intervals
When constructing confidence intervals for population proportions, there is a fundamental trade-off between certainty and precision. A very wide interval (e.g., 0% to 100%) offers high certainty but little practical value, while a very narrow interval provides high precision but low certainty. The goal is to balance these two aspects to make meaningful statistical statements.
Certainty: The probability that the interval contains the true population proportion.
Precision: The width of the interval; narrower intervals are more precise.
Trade-off: Increasing certainty (confidence level) widens the interval, decreasing precision.
Example: A weather forecast stating the temperature will be between 40 below zero and 200 above is certain but not precise.

Structure of a Confidence Interval for Proportions
A confidence interval for a population proportion is constructed using the sample proportion, a critical value from the Normal distribution, and the standard error. The margin of error (ME) quantifies the uncertainty in the estimate.
General Form: Estimate ± Margin of Error (ME)
Margin of Error Formula:
z*: Critical value for desired confidence level (e.g., 1.96 for 95%, 1.645 for 90%)
Increasing confidence level: Increases z* and ME, making the interval wider.
Decreasing confidence level: Decreases z* and ME, making the interval narrower.
Calculating Margin of Error: Examples
Margin of error can be calculated using the sample proportion or conservatively with p = 0.5 if the proportion is unknown.
Example 1: For a sample of 1520 adults, 52% responded "Never" to reading newspapers. For a 90% confidence interval:
Margin of error is about 2.1%.
Example 2 (Conservative): For the same sample, maximum ME for 95% confidence:
Margin of error is about 2.51%.
Interpreting Confidence Intervals
Confidence intervals are often misunderstood. The correct interpretation is that we are confident the interval contains the true population proportion, not the sample proportion.
Correct: "We are 99% confident that the population proportion is contained in our interval."
Incorrect: "There is a 99% chance the sample proportion is in our interval."
Interval Width: A 99% confidence interval is wider than a 95% confidence interval.
Example: Confidence Interval for a Proportion
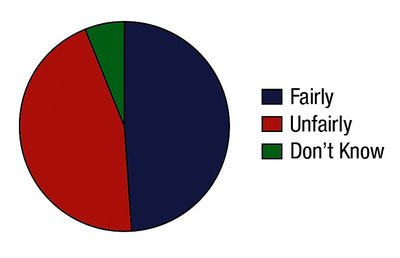
Suppose 1015 adults are surveyed about the fairness of the death penalty. 49% say "Fairly," 45% "Unfairly," and 6% "Don't Know." To find the margin of error and confidence interval for the proportion who think it is applied unfairly:
Sample size: n = 1015
Sample proportion:
For 90% confidence:
Standard error:
Margin of error:
Reducing Margin of Error
To reduce the margin of error without lowering the confidence level, increase the sample size. Lowering the critical value (z*) also reduces ME but decreases confidence.
Increase sample size: Reduces ME while maintaining confidence.
Decrease z*: Reduces ME but lowers confidence.
Decrease sample size: Increases ME.
Conditions for Using the Normal Model
Before constructing a confidence interval for a proportion, certain conditions must be met to justify the use of the Normal model:
Randomization Assumption: The sample must be random and respondents independent.
10% Condition: The sample size should be less than 10% of the population.
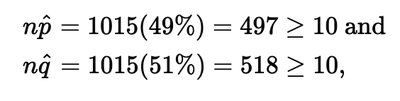
Success/Failure Condition: Both and must be at least 10.
Constructing a Confidence Interval: Step-by-Step Example
For the survey on the fairness of the death penalty:
Sample size: n = 1015
Sample proportion: ("Fairly")
Standard error:
Margin of error:
Confidence interval: or
Conclusion: We are 95% confident that the proportion of all U.S. adults who think the death penalty is applied fairly is between 0.459 and 0.521.
Summary Table: Confidence Interval Components
Component | Description |
|---|---|
Sample Proportion () | Observed proportion in sample |
Critical Value () | Depends on confidence level (e.g., 1.96 for 95%) |
Standard Error () | |
Margin of Error (ME) | |
Confidence Interval |
