 Back
Back6.3 Sampling Distributions and Estimators: Chapter 6 Study Notes
Study Guide - Smart Notes
 Tailored notes based on your materials, expanded with key definitions, examples, and context.
Normal Probability Distributions
Sampling Distributions and Estimators
This section explores the concept of sampling distributions, which are fundamental in inferential statistics. Sampling distributions describe how statistics (such as sample means, proportions, or variances) behave when samples are repeatedly drawn from a population. Understanding these distributions is essential for estimating population parameters and assessing the reliability of statistical inference.
Sampling Distribution of a Statistic
Definition and Key Concepts
Sampling Distribution: The distribution of all values of a statistic (e.g., sample mean, sample proportion) when all possible samples of the same size n are taken from the same population.
Representation: Sampling distributions are typically shown as probability histograms, formulas, or tables.
Purpose: They allow us to understand the variability and expected value of statistics used to estimate population parameters.
Example: Survey Proportions
Suppose 70% of adults in a population do not feel comfortable in a self-driving vehicle. In a survey of 1000 adults, 69% reported discomfort. If 50,000 people each conduct their own survey of 1000 adults, the sample proportions will vary, but their distribution will center around the population proportion.

General Behavior of Sampling Distributions
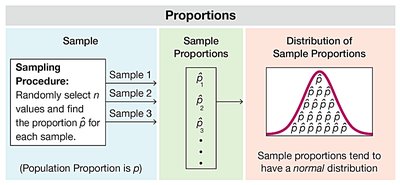
Properties of Sample Proportions
Sample proportions tend to be normally distributed as sample size increases.
The mean of all sample proportions equals the population proportion (p).
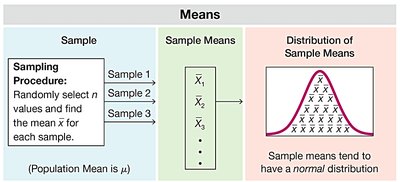
Properties of Sample Means
Sample means tend to be normally distributed as sample size increases.
The mean of all sample means equals the population mean (μ).
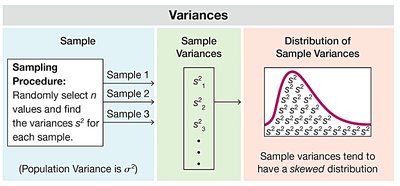
Properties of Sample Variances
Sample variances tend to have a skewed distribution (right-skewed).
The mean of all sample variances equals the population variance (σ²).
Sampling Distribution of the Sample Proportion
Definition and Notation
The sampling distribution of the sample proportion (\hat{p}) is the distribution of sample proportions from all samples of size n drawn from the population.
Notation:
x = number of successes
n = sample size
N = population size
\hat{p} = x/n (sample proportion)
p = x/N (population proportion)
Behavior of Sample Proportions
The distribution of sample proportions approximates a normal distribution.
The mean of all sample proportions \hat{p} equals the population proportion p.
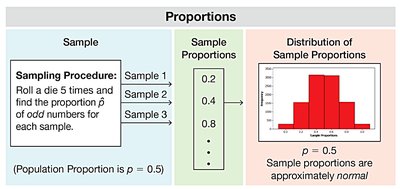
Example: Rolling a Die
Roll a die 5 times and find the proportion of odd numbers. Repeating this process many times produces a sampling distribution of sample proportions.

The sample proportions are approximately normally distributed, with a mean of 0.5 (since half the numbers on a die are odd).
Sampling Distribution of the Sample Mean
Definition and Behavior
The sampling distribution of the sample mean (\bar{x}) is the distribution of all possible sample means from samples of size n drawn from the population.
Sample means tend to be normally distributed as sample size increases (Central Limit Theorem).
The mean of the sample means equals the population mean (μ).
Example: Rolling a Die
Roll a die 5 times and find the mean of the results. Repeating this process many times produces a sampling distribution of sample means.
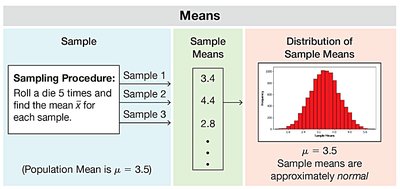
The sample means are approximately normally distributed, with a mean of 3.5 (the population mean for a fair die).
Sampling Distribution of the Sample Variance
Definition and Behavior
The sampling distribution of the sample variance (s^2) is the distribution of sample variances from all samples of size n drawn from the population.
Sample variances tend to have a right-skewed distribution.
The mean of the sample variances equals the population variance (σ^2).
Population Standard Deviation and Variance
Population standard deviation:
Population variance:
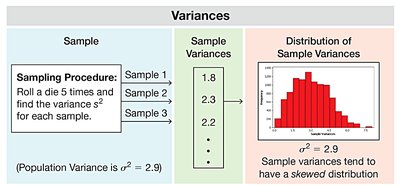
Example: Rolling a Die
Roll a die 5 times and find the variance of the results. Repeating this process many times produces a sampling distribution of sample variances.

The sample variances have a mean of 2.9 (the population variance for a fair die) and are right-skewed.

Estimators: Unbiased and Biased
Definition of Estimator
Estimator: A statistic used to infer or estimate the value of a population parameter.
Unbiased Estimator: A statistic whose sampling distribution has a mean equal to the population parameter.
Unbiased Estimators
Sample proportion (\hat{p})
Sample mean (\bar{x})
Sample variance (s^2)
Biased Estimators
Sample median
Sample range
Sample standard deviation (s)
The sample standard deviation s is a biased estimator of the population standard deviation σ, but the bias is small for large samples. The sample variance s^2 is an unbiased estimator of the population variance σ^2.
Sampling with Replacement
Why Sample with Replacement?
For small samples from large populations, sampling with or without replacement makes little difference.
Sampling with replacement ensures independent events, simplifying analysis and calculations.
