 Back
Sampling Distributions and Sample Proportions: Study Notes for Introductory Statistics
Study Guide - Smart Notes
 Tailored notes based on your materials, expanded with key definitions, examples, and context.
Sampling Distributions
Sampling Distribution of Sample Means
The sampling distribution of the sample mean is a probability distribution of all possible values of the sample mean computed from samples of size n drawn from a population. This concept is fundamental in inferential statistics, as it allows us to make probabilistic statements about sample means.
Population Distribution: The distribution of all individual data values in the population. The center is the population mean (), the spread is the population standard deviation (), and the shape depends on the data.
Sample Mean (): A statistic whose value varies from sample to sample, and thus has its own probability distribution.
Sampling Distribution: The probability distribution of for all possible samples of size n.
Key Properties:
Center: The mean of the sampling distribution of is equal to the population mean ().
Spread: The standard deviation (standard error) of the sampling distribution of is .
Shape: If the population is normal, the sampling distribution is normal for any sample size. If the population is not normal, the sampling distribution becomes approximately normal as n increases (Central Limit Theorem).
Obtaining the Sampling Distribution:
Obtain a simple random sample of size n.
Compute the sample mean.
Repeat for all distinct simple random samples of size n.
Central Limit Theorem (CLT)
The Central Limit Theorem states that regardless of the shape of the underlying population, the sampling distribution of becomes approximately normal as the sample size n increases. This is a cornerstone of statistical inference.
Normality: For large n, is approximately normally distributed even if the population is not normal.
Standard Error: decreases as n increases, making sample means more tightly clustered around .

Examples: Probability of Sample Means
To find the probability that a sample mean exceeds a certain value, convert the sample mean to a z-score and use the normal distribution.
Formula for z-score:
Example: If IQ scores are normal with , , and , the probability that is found by calculating the z-score and looking up the area to the right.
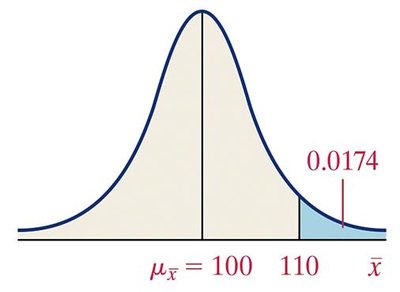
Interpretation: If the population mean is 100, about 2 out of 100 samples of size 10 will have a mean greater than 110.
Application: Weight Gain During Pregnancy
When the population is skewed, the CLT allows us to use the normal distribution for sample means if n is large enough. For example, if the mean weight gain is 30 pounds (), , and , the probability of a sample mean of 36.2 or more is calculated using the z-score.
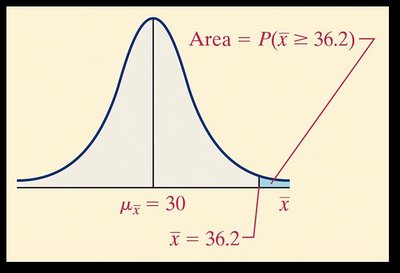
Interpretation: Such a result is unusual, suggesting the sample may not represent the population or the population mean is higher than assumed.
Sampling Distribution of Sample Proportions
Point Estimate of a Population Proportion
The sample proportion () is a statistic used to estimate the population proportion (p). It is calculated as , where x is the number of individuals with the characteristic of interest in a sample of size n.
Example: In a survey of 1200 adults, 552 plan to work while on vacation. .
Properties of the Sampling Distribution of
Shape: As n increases, the distribution of becomes approximately normal if and .
Center: The mean of the sampling distribution of is .
Spread: The standard deviation is .
Examples: Probability of Sample Proportions
To find the probability that a sample proportion is less than or greater than a certain value, convert to a z-score:
Formula for z-score:
Example: If 15% of Americans have hearing trouble (), in a sample of 120, the probability that at most 12% have hearing trouble is found by calculating the z-score for .
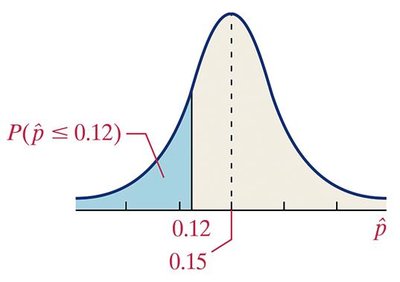
Interpretation: About 18 out of 100 samples of size 120 will result in at most 12% having hearing trouble if the population proportion is 0.15.
Similarly, to determine if a sample proportion is unusually high, calculate the probability of obtaining or more.
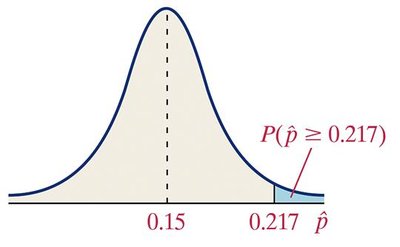
Interpretation: If only about 2 out of 100 samples would result in a proportion of 0.217 or higher, this suggests the sample is unusual, possibly indicating the population proportion is higher than assumed.
Summary Table: Shape, Center, and Spread
The following table summarizes the properties of sampling distributions for sample means and sample proportions:
Population Distribution | Sampling Distribution Shape | Sampling Distribution Center | Sampling Distribution Spread |
|---|---|---|---|
Normal (mean , std dev ) | Normal for any sample size | ||
Not normal (mean , std dev ) | Approximately normal as increases | ||
Proportion | Approximately normal if and |
Additional info: The notes above expand on brief slide points, providing full academic context, definitions, and examples for clarity and completeness.
