 Back
BackSampling Distributions and the Central Limit Theorem
Study Guide - Smart Notes
 Tailored notes based on your materials, expanded with key definitions, examples, and context.
Sampling Distributions & Confidence Intervals: Mean
Sampling Distributions
The concept of a sampling distribution is fundamental in inferential statistics. It refers to the probability distribution of a given statistic (such as the mean) based on a random sample. Understanding the behavior of sample means is crucial for making inferences about populations.
Definition: The sampling distribution of the sample mean is the distribution of all possible sample means for all samples of size n taken from the same population.
Population for Sampling Distribution: All possible samples of size n from the original population.
Mean of Sampling Distribution: The average of all sample means equals the population mean (μ).
Standard Deviation of Sampling Distribution: Known as the standard error, calculated as where σ is the population standard deviation and n is the sample size.
Shape: The shape of the sampling distribution depends on the sample size and the shape of the population distribution.
Example: Coin-Tossing Experiment
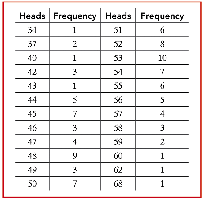
John Kerrich, while a prisoner of war, tossed a coin 10,000 times and recorded the number of heads. He grouped the tosses into samples of 100 and tallied the number of heads in each group. The results illustrate the concept of a sampling distribution.
Heads | Frequency | Heads | Frequency |
|---|---|---|---|
51 | 1 | 51 | 4 |
57 | 2 | 52 | 8 |
42 | 1 | 53 | 10 |
43 | 1 | 54 | 7 |
44 | 5 | 55 | 6 |
45 | 7 | 56 | 4 |
46 | 7 | 57 | 4 |
47 | 9 | 58 | 2 |
48 | 9 | 59 | 1 |
49 | 7 | 60 | 1 |
50 | 7 | 61 | 1 |
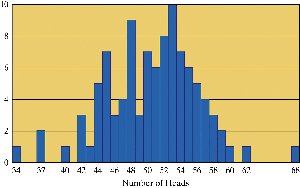
The bar graph below shows the distribution of the number of heads in each group of 100 tosses. While not perfectly bell-shaped, it demonstrates the tendency toward a normal distribution as sample size increases.
The Central Limit Theorem (CLT)
The Central Limit Theorem is a cornerstone of statistics. It describes the shape of the sampling distribution of the sample mean, regardless of the population's distribution, under certain conditions.
Statement: For a population with mean μ and standard deviation σ, the sampling distribution of the sample mean for samples of size n will approach a normal distribution as n increases, regardless of the population's original distribution.
Mean of Sampling Distribution:
Standard Error:
Practical Rules
If n > 30, the sampling distribution of the mean is approximately normal, even if the population is not normal.
If the population is normal, the sampling distribution of the mean is normal for any sample size n.
Finding Probabilities for Sample Means
Probabilities involving sample means can be found using the normal distribution (by the CLT), especially when n is large or the population is normal.
Standardize the sample mean:
Use the standard normal table to find probabilities.
Examples
Example 1: Women's Heights
Population mean (μ): 63.1 in
Population standard deviation (σ): 2.6 in
Sample size (n): 31
Find: Probability that the sample mean is less than 64 in.
Solution:
Calculate standard error:
Find z-score:
Use the z-table to find the probability.
Example 2: Ski Gondola Weight Limit
Population mean (μ): 169.6 lb
Population standard deviation (σ): 43.1 lb
Sample size (n): 15
Weight limit per person: 175 lb
Probability an individual exceeds 175 lb:
Find z-score:
Use the z-table to find the probability.
Probability that the mean of 15 exceeds 175 lb:
Standard error:
z-score:
Use the z-table to find the probability.
Interpretation: If the probability is not very small (e.g., 31.2%), the weight limit may not be adequate for safety.
Summary Table: Central Limit Theorem Properties
Property | Description |
|---|---|
Mean of Sampling Distribution | Equals population mean (μ) |
Standard Error | |
Shape | Approximately normal if n > 30 or population is normal |
