 Back
BackSampling Distributions and the Central Limit Theorem
Study Guide - Smart Notes
 Tailored notes based on your materials, expanded with key definitions, examples, and context.
Sampling Distributions
Definition and Overview
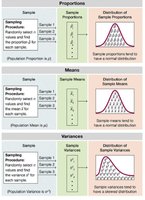
The sampling distribution of a statistic (such as a sample proportion, sample mean, or sample variance) is the probability distribution of all possible values of that statistic when all possible samples of a fixed size n are drawn from the same population. Sampling distributions are fundamental in inferential statistics, as they describe the variability of sample statistics and allow for estimation and hypothesis testing.
Statistic: A numerical measure calculated from a sample (e.g., sample mean, sample proportion).
Sampling Distribution: The distribution of a statistic over all possible samples of size n from a population.
Representation: Sampling distributions are often visualized as probability histograms, formulas, or tables.
Sample Proportions
Definition and Properties
The sample proportion is the fraction of items in a sample that possess a certain characteristic. The sampling distribution of sample proportions describes how these proportions vary from sample to sample.
Notation: denotes the sample proportion; denotes the population proportion.
Distribution: For large sample sizes, the sampling distribution of sample proportions tends to be normal (by the Central Limit Theorem).
Mean:
Standard Deviation:
Example: If 40% of a population supports a policy (), the sample proportion from random samples of size will vary, but the distribution of $\hat{p}$ will be centered at 0.4.
Sample Means
Definition and Properties
The sample mean is the average value of a variable in a sample. The sampling distribution of sample means describes how these averages vary across samples.
Notation: denotes the sample mean; denotes the population mean.
Distribution: The sampling distribution of sample means tends to be normal, especially as sample size increases (Central Limit Theorem).
Mean:
Standard Deviation:
Example: If the population mean height is 170 cm, the sample means from random samples of size will vary, but their distribution will be centered at 170 cm.
Sample Variances
Definition and Properties
The sample variance measures the spread of values in a sample. The sampling distribution of sample variances describes how these variances vary across samples.
Notation: denotes the sample variance; denotes the population variance.
Distribution: The sampling distribution of sample variances is skewed to the right and does not follow a normal distribution.
Mean: The mean of the sample variances equals the population variance:
Implication: Because the distribution is not normal, standard methods for normal distributions do not apply.
Example: If the population variance is 25, the sample variances from random samples will vary, but their average will be close to 25, though the distribution is skewed.
The Central Limit Theorem (CLT)
Statement and Importance
The Central Limit Theorem is a fundamental result in statistics. It states that, for a sufficiently large sample size, the sampling distribution of the sample mean (or sample proportion) will be approximately normal, regardless of the shape of the population distribution.
Formal Statement: If are independent, identically distributed random variables with mean and variance , then the distribution of approaches normal as increases.
Mathematical Expression: for large
Applications: Allows for confidence intervals and hypothesis tests using normal distribution methods.
Example: Even if the population is skewed, the distribution of sample means from samples of size will be nearly normal.
Summary Table: Sampling Distributions
The following table summarizes the behavior of sampling distributions for proportions, means, and variances:
Statistic | Sampling Distribution Shape | Targets Population Value? | Notes |
|---|---|---|---|
Sample Proportion () | Normal (for large ) | Yes () | CLT applies; used for binomial proportions |
Sample Mean () | Normal (for large ) | Yes () | CLT applies; used for quantitative data |
Sample Variance () | Skewed right | Yes () | Not normal; special methods required |
