 Back
BackSampling Distributions and the Central Limit Theorem: Study Notes
Study Guide - Smart Notes
 Tailored notes based on your materials, expanded with key definitions, examples, and context.
Normal Probability Distributions
Sampling Distributions and the Central Limit Theorem
This section explores the concept of sampling distributions, their properties, and the Central Limit Theorem (CLT), which is fundamental in inferential statistics. Understanding these topics is essential for analyzing sample means and estimating probabilities in large populations.
Sampling Distributions
Definition: A sampling distribution is the probability distribution of a sample statistic (such as the mean) formed when random samples of size n are repeatedly taken from a population.
Sampling Distribution of Sample Means: The distribution of the means of all possible samples of a given size n from a population.
Purpose: Allows statisticians to make inferences about population parameters based on sample statistics.
Properties of Sampling Distributions of Sample Means
Mean of Sample Means: The mean of the sampling distribution of sample means is equal to the population mean ().
Standard Deviation (Standard Error): The standard deviation of the sampling distribution of sample means is called the standard error of the mean and is given by: where is the population standard deviation and is the sample size.
Variance of Sample Means: The variance of the sampling distribution is:
Example: Constructing a Sampling Distribution
Suppose the number of times four people go grocery shopping in a month is given by population values. If you randomly choose two of the four people (with replacement), list all possible samples of size n = 2 and calculate the mean of each. These means form the sampling distribution of sample means. The mean, variance, and standard deviation of these sample means can be compared to those of the population.
Key Steps:
List all possible samples.
Calculate the mean for each sample.
Construct the probability distribution and histogram.
Compute mean, variance, and standard deviation of sample means.
The Central Limit Theorem (CLT)
The Central Limit Theorem is a cornerstone of statistics, stating that the sampling distribution of the sample means approaches a normal distribution as the sample size increases, regardless of the population's distribution.
Statement: If samples of size n are drawn from any population with mean and standard deviation , the sampling distribution of the sample means will approximate a normal distribution as n increases.
Normal Population: If the population is normally distributed, the sampling distribution of sample means is normal for any sample size n.
Mean and Standard Error:
Mean:
Standard Error:
Variance:
Example: Interpreting the Central Limit Theorem
Sleep Times: A study finds the mean sleep time for college students is 6.7 hours with a standard deviation of 0.8 hours. For samples of 100 students:
Mean of sampling distribution: 6.7 hours
Standard error: hours
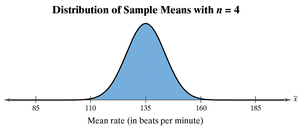
Training Heart Rates: For a normally distributed population with mean 135 bpm and standard deviation 18 bpm, samples of size 4:
Mean: 135 bpm
Standard error: bpm
Finding Probabilities for Sampling Distributions
To find probabilities for sample means, use the z-score formula and the Standard Normal Table.
Z-score for Sample Mean:
Application: For a sample of 50 drivers, the probability that the mean distance traveled is between two values can be found by calculating z-scores for both values and using the Standard Normal Table.
Room and Board Example: For a population mean of $13,175 and standard deviation $1,650, sample size 9:
Standard error:
Find z-score for $13,600 and use the table to find probability.
Comparing Probabilities for Individual Values and Sample Means
Example: For a population mean of $2,268 and standard deviation $750:
Probability a single student paid less than $2,000: 0.3594
Probability the mean of 25 students is less than $2,000: 0.0367
Interpretation: The probability for the sample mean is much lower, illustrating the effect of the Central Limit Theorem and the reduced variability in sample means.
Summary Table: Properties of Sampling Distributions
Property | Formula | Description |
|---|---|---|
Mean of Sample Means | Equal to population mean | |
Standard Error | Population standard deviation divided by square root of sample size | |
Variance | Population variance divided by sample size |
Additional info: The Central Limit Theorem is especially important for large sample sizes (n > 30), where the sampling distribution of the mean becomes approximately normal, even if the population distribution is not normal.
