 Back
BackSampling Distributions and the Normal Probability Distribution: Study Notes
Study Guide - Smart Notes
 Tailored notes based on your materials, expanded with key definitions, examples, and context.
Sampling Distributions and the Normal Probability Distribution
Introduction to Sampling Distributions
Sampling distributions are fundamental in inferential statistics, allowing us to make probability-based statements about sample statistics. The normal probability distribution is often used to model the behavior of sample means and proportions, especially when the sample size is large.
The Normal Probability Distribution
Properties and Applications
The normal distribution is a continuous probability distribution characterized by its bell-shaped curve, symmetric about the mean. It is defined by two parameters: the mean (μ) and the standard deviation (σ). Many real-world phenomena are approximately normally distributed, making this distribution essential in statistics.
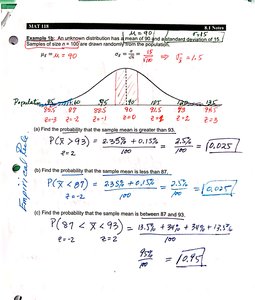
Empirical Rule: Approximately 68% of data falls within 1 standard deviation, 95% within 2, and 99.7% within 3 standard deviations of the mean.
Z-score: The standardized value representing the number of standard deviations a data point is from the mean.
Formula for Z-score:
Application: Z-scores are used to find probabilities and percentiles for normal distributions.
Sampling Distribution of the Sample Mean
Central Limit Theorem (CLT)
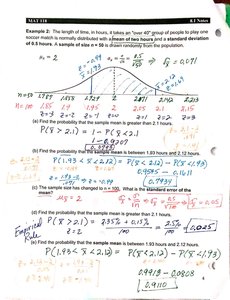
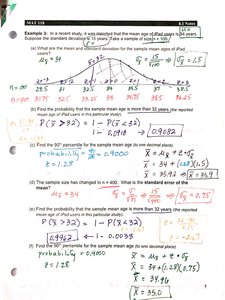
The Central Limit Theorem states that, for a sufficiently large sample size, the sampling distribution of the sample mean will be approximately normal, regardless of the population's distribution, with mean μ and standard deviation σ/√n.
Mean of the sampling distribution:
Standard error (SE):
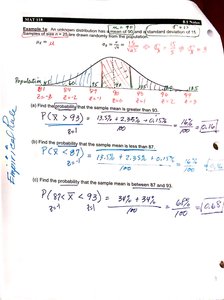
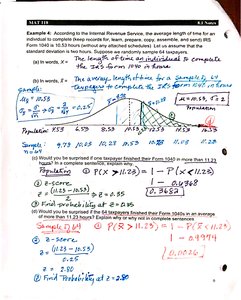
Example: If the population mean is 90 and the standard deviation is 15, for a sample size of 100, the standard error is .
Finding Probabilities for Sample Means
To find the probability that a sample mean falls within a certain range, convert the sample mean to a z-score using the standard error, then use the standard normal table.
Calculate the probability for a single value or between two values using the cumulative distribution function (CDF) of the standard normal distribution.
Percentiles and Probabilities in Sampling Distributions
Percentiles
The k-th percentile is the value below which k% of the observations fall. To find a percentile in a sampling distribution, use the z-score corresponding to the desired percentile and solve for the sample mean.
Example: To find the 95th percentile, use for a one-tailed test.
Application: Real-World Scenarios
Interpreting Results
Sampling distributions are used to answer questions about probabilities, percentiles, and expected values in real-world contexts, such as average completion times, ages, or survey responses.
Translate word problems into probability statements about sample means or proportions.
Use the normal distribution and z-scores to solve these problems.
Sampling Distribution of the Sample Proportion
Definitions and Properties
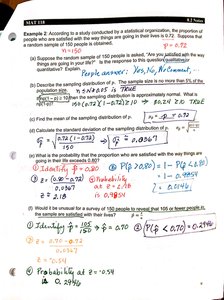
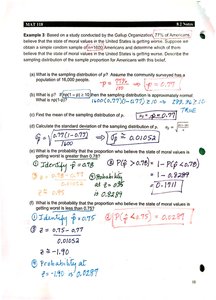
The sampling distribution of the sample proportion describes the distribution of sample proportions (p̂) from repeated samples of the same size from a population. For large samples, this distribution is approximately normal.
Sample Proportion (p̂): , where x is the number of successes in the sample.
Mean of p̂:
Standard deviation of p̂ (Standard Error):
The distribution is approximately normal if and .
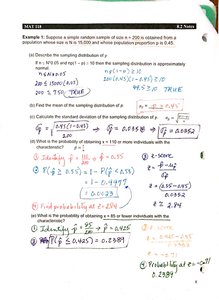
Finding Probabilities for Sample Proportions
To find the probability that the sample proportion falls within a certain range, convert the sample proportion to a z-score using the standard error, then use the standard normal table.
Calculate the probability for a single value or between two values using the cumulative distribution function (CDF) of the standard normal distribution.
Summary Table: Key Formulas
Concept | Formula | Conditions |
|---|---|---|
Sample Mean (\(\bar{X}\)) | n observations | |
Standard Error (Mean) | Population SD known | |
Sample Proportion (\(\hat{p}\)) | x successes in n trials | |
Standard Error (Proportion) | , | |
Z-score (Mean) | Normal or large n | |
Z-score (Proportion) | Normal or large n |
Additional info: These notes cover material from Ch. 7 (The Normal Probability Distribution) and Ch. 8 (Sampling Distributions), including applications to real-world problems, calculation of probabilities, and the use of the empirical rule.
