 Back
Sampling Distributions for Means and Proportions: Central Limit Theorem and Applications
Study Guide - Smart Notes
 Tailored notes based on your materials, expanded with key definitions, examples, and context.
Sampling Distributions & Confidence Intervals: Mean and Proportion
Sampling Distributions: Definition and Importance
The sampling distribution of a statistic is the probability distribution that specifies probabilities for the possible values the statistic can take. Unlike a population distribution, which describes the probabilities for outcomes of a random variable, a sampling distribution describes the probabilities for values of a statistic computed from a sample.
Purpose: Helps determine how close a sample statistic is likely to be to the population parameter.
Key Features:
If sample size n > 30, the shape is approximately normal.
The distribution is centered at the population parameter.
The spread decreases as sample size n increases.
Sampling Distributions for Sample Means
A sampling distribution for sample means examines the distribution of sample mean outcomes from multiple samples. The Central Limit Theorem (CLT) is fundamental in understanding these distributions.
Central Limit Theorem: For a random variable with any type of distribution, the distribution of sample means (or proportions) from multiple samples approximates a normal distribution as sample size n increases.
For samples of size n from a normal population or with n > 30, the sampling distribution of can be approximated by:
A normal distribution
Mean: (population mean)
Standard deviation: (population standard deviation divided by the square root of sample size)
Example: Dice Rolls
Simulate 1000 rolls of a die and draw the frequency distribution.
Simulate 1000 rolls of two dice, average the two rolls to get , and draw the frequency distribution.
Simulate 1000 rolls of thirty dice, average the thirty rolls to get , and draw the frequency distribution.
As sample size increases, the distribution of sample means becomes more normal and less spread out.
Example: Water Taxi Safe Load
Population mean weight: lb, standard deviation lb.
Find probability that a randomly selected individual has weight > 175 lb.
Find probability that 20 randomly selected men have mean weight > 175 lb.
Use normal distribution and CLT for calculations.
Example: Phone Call Durations
Population mean: min, standard deviation min.
Sample mean: min, sample standard deviation min, .
Calculate mean and standard deviation of sampling distribution: , min.
Find z-score for and interpret if it is unusually high.
Calculate probability of sample mean exceeding 4.5 min.
Example: Human Body Temperature
Population mean: °F, standard deviation °F, .
Find probability of sample mean °F.
Interpret if 98.2° is an unusually low sample mean.
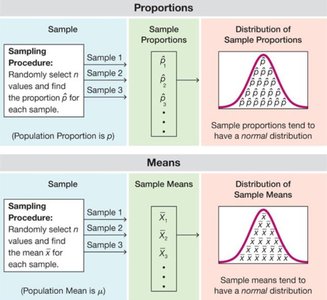
Sampling Distributions for Sample Proportions
A sampling distribution for sample proportions examines the distribution of sample proportion outcomes from multiple samples. The mean and standard deviation depend on sample size n and population proportion p.
For a random sample of size n from a population with proportion p, if and , the sampling distribution of has:
A normal shape
Mean:
Standard deviation:
Example: Student Preferences (Coke vs. Pepsi)
Population proportion:
Sample size : , (not both > 15, so normal approximation not valid)
Sample size : , (both > 15, so normal approximation valid)
Calculate probability that sample proportion > 2/3 for .
Example: Mayoral Election Poll
Population proportion:
Sample size : , (normal approximation valid)
Find probability of sample proportion
Find probability of
Repeat for
Example: Debit Card Usage Survey
Population proportion:
Sample size : , (normal approximation valid)
Sample proportion:
Find probability of sample proportion
Summary Table: Sampling Distributions for Means and Proportions
Statistic | Mean | Standard Deviation | Normal Approximation Criteria |
|---|---|---|---|
Sample Mean () | Population normal or | ||
Sample Proportion () | and |
Additional info: The Central Limit Theorem is a cornerstone of inferential statistics, allowing us to use normal probability models for sample means and proportions, even when the underlying population distribution is not normal, provided sample size is sufficiently large.
