 Back
Sampling Distributions for Means and Proportions: Central Limit Theorem and Applications
Study Guide - Smart Notes
 Tailored notes based on your materials, expanded with key definitions, examples, and context.
Sampling Distributions
Definition and Importance
The sampling distribution of a statistic is the probability distribution that specifies probabilities for the possible values the statistic can take. Unlike a population distribution, which describes the probabilities for individual outcomes, a sampling distribution describes the probabilities for statistics (such as the mean or proportion) computed from samples.
Purpose: Helps determine how close a sample statistic is likely to be to the population parameter.
Key Features:
If sample size n > 30, the shape is approximately normal.
The distribution is centered at the population parameter.
The spread decreases as sample size increases.
Sampling Distributions for Sample Means
Central Limit Theorem (CLT)
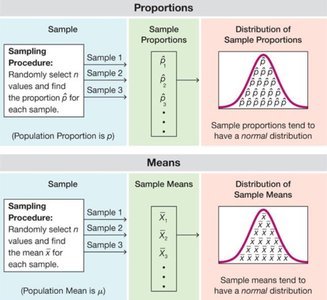
The Central Limit Theorem states that for a random variable with any type of distribution (e.g., uniform, skewed), the distribution of sample means (or proportions) from multiple samples approximates a normal distribution as the sample size increases.
For samples of size n from a normal population or with n > 30, the sampling distribution of the sample mean \( \bar{x} \) can be approximated by:
Normal distribution
Mean: \( \mu_{\bar{x}} = \mu \) (population mean)
Standard deviation: \( \sigma_{\bar{x}} = \frac{\sigma}{\sqrt{n}} \) (population standard deviation divided by the square root of sample size)
Example: Simulating dice rolls demonstrates how the distribution of sample means becomes more normal as the sample size increases.
Applications and Examples
Probability Calculations: Use the normal distribution to find probabilities for sample means, such as the likelihood that a sample mean exceeds a certain value.
Z-score Calculation: To determine if a sample mean is unusually high or low, calculate its z-score:
\( z = \frac{\bar{x} - \mu}{\sigma_{\bar{x}}} \)
Example: If the population mean weight is 172 lb with a standard deviation of 29 lb, and a sample of 20 men has a mean weight greater than 175 lb, use the CLT to find the probability.
Sampling Distributions for Sample Proportions
Definition and Properties
A sampling distribution for sample proportions describes the distribution of sample proportion outcomes from multiple samples. The mean and standard deviation depend on the sample size n and the population proportion p.
For a random sample of size n from a population with proportion p, if \( np > 15 \) and \( n(1-p) > 15 \), the sampling distribution of the sample proportion \( \hat{p} \) has:
Normal shape
Mean: \( \mu_{\hat{p}} = p \)
Standard deviation: \( \sigma_{\hat{p}} = \sqrt{\frac{p(1-p)}{n}} \)
Applications and Examples
Normal Approximation: For small samples, normal approximation may not be valid. For larger samples, it is appropriate.
Probability Calculations: Use the normal distribution to approximate probabilities for sample proportions, such as the likelihood that a sample proportion exceeds a certain value.
Example: If 80% of a population prefers Coke, and a sample of 200 students is taken, calculate the probability that more than 2/3 prefer Coke.
Summary Table: Sampling Distributions for Means and Proportions
Statistic | Mean | Standard Deviation | Normal Approximation Criteria |
|---|---|---|---|
Sample Mean (\( \bar{x} \)) | \( \mu \) | \( \frac{\sigma}{\sqrt{n}} \) | Population normal or n > 30 |
Sample Proportion (\( \hat{p} \)) | \( p \) | \( \sqrt{\frac{p(1-p)}{n}} \) | \( np > 15 \) and \( n(1-p) > 15 \) |
Visual Representation of Sampling Distributions
The following image illustrates the process of generating sampling distributions for both sample proportions and sample means. It shows how repeated random sampling produces distributions that tend to be normal in shape, centered at the population parameter.
Key Takeaways
Sampling distributions are fundamental for understanding statistical inference.
The Central Limit Theorem ensures normality for sample means and proportions under appropriate conditions.
Probability calculations for sample statistics rely on the properties of their sampling distributions.
Additional info: Academic context was added to clarify the Central Limit Theorem, z-score calculation, and the conditions for normal approximation in sampling distributions.
