 Back
Scatterplots, Association, and Correlation: Study Notes for Introductory Statistics
Study Guide - Smart Notes
 Tailored notes based on your materials, expanded with key definitions, examples, and context.
Scatterplots, Association, and Correlation
Introduction to Bivariate Data
Bivariate data involves the analysis of two variables to explore their relationship. In statistics, visual tools such as mosaic plots and box plots are used to compare categorical and quantitative variables, respectively. When both variables are quantitative, scatterplots are the primary method for visualizing their association.
Scatterplots
Scatterplots are graphical representations that display the relationship between two quantitative variables. Each point represents an observation with values for both variables.
Direction: Indicates whether the relationship is positive, negative, or neither.
Form: Describes whether the relationship is linear (straight line) or nonlinear (curved or other patterns).
Strength: Measures how closely the data points follow a specific form.
Unusual Features: Includes outliers, clusters, or subgroups that deviate from the general pattern.
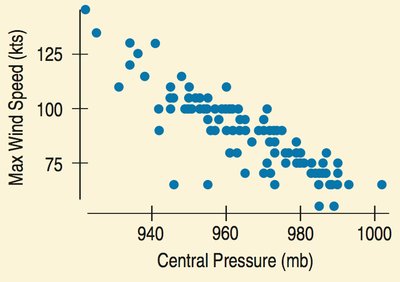
Direction
The direction of a scatterplot can be positive (both variables increase together), negative (one increases as the other decreases), or show no clear pattern.
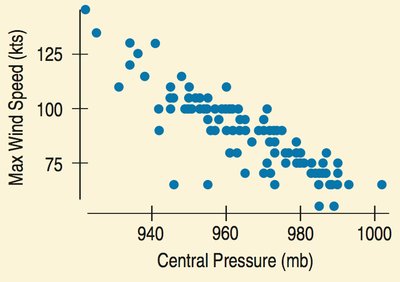
Form
Most commonly, relationships are linear, but they can also be nonlinear. Identifying the form helps determine the appropriate statistical analysis.

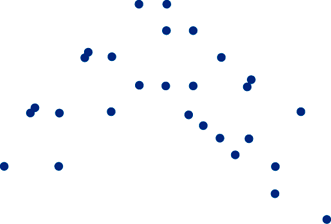
Strength
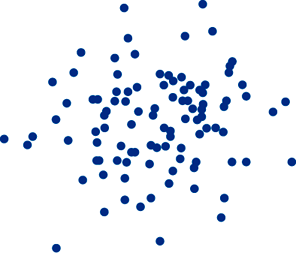
Strength refers to how tightly the points cluster around a form. Strong relationships have points closely grouped, while weak relationships are more scattered.
Unusual Features
Outliers are points that deviate significantly from the overall pattern. Clusters or subgroups may indicate underlying factors affecting the data.
Roles for Variables
In bivariate analysis, variables are classified as:
Response Variable (y): The variable of interest, often predicted or explained.
Explanatory Variable (x): The variable used to predict or explain the response.
Timeplots
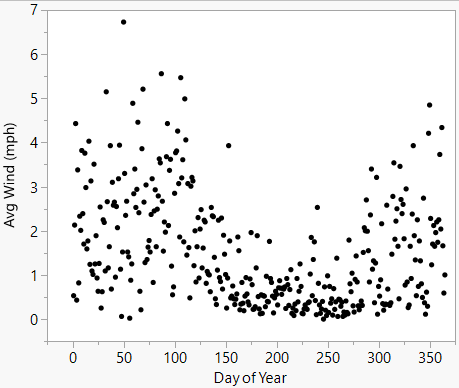
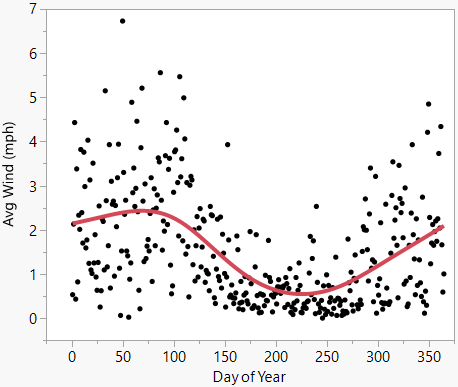
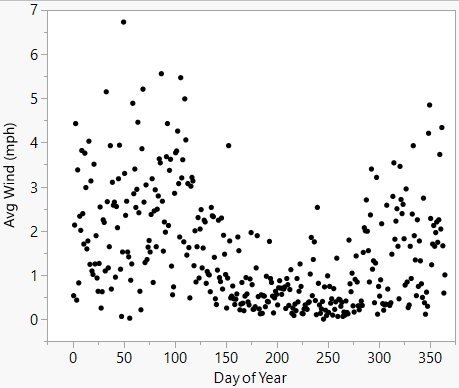
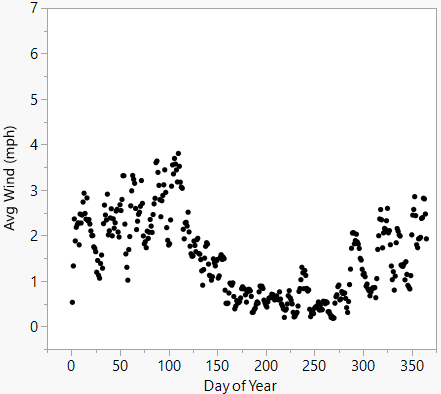
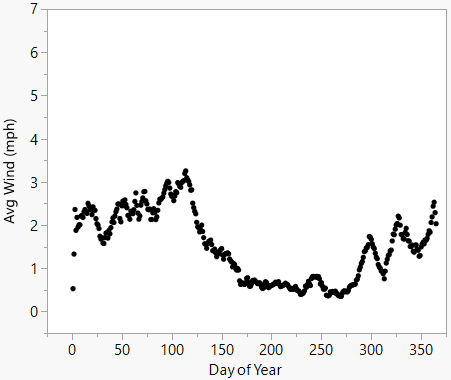
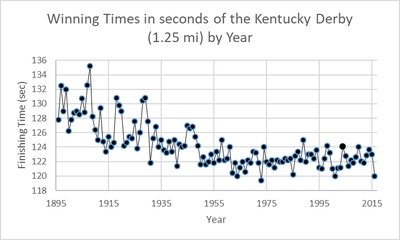
Timeplots are used when data is collected over time, displaying how a variable changes across time intervals. Smoothing techniques, such as moving averages, help reveal long-term trends by reducing local variation.
Statistical Process Control (SPC)
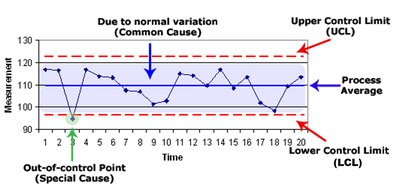
SPC uses control charts to monitor time-ordered data in business and manufacturing. Control charts display the process average and control limits, identifying points that may require investigation.
Histograms vs. Timeplots
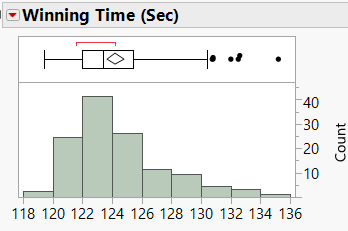
Histograms summarize the distribution of a variable, while timeplots reveal patterns and trends over time. For example, winning times in the Kentucky Derby can be visualized both ways.
Correlation
Measuring the Strength of a Linear Relationship
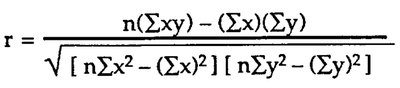
The correlation coefficient (r) quantifies the strength and direction of a linear relationship between two quantitative variables. The formula is:
Alternative formula:
Correlation Example
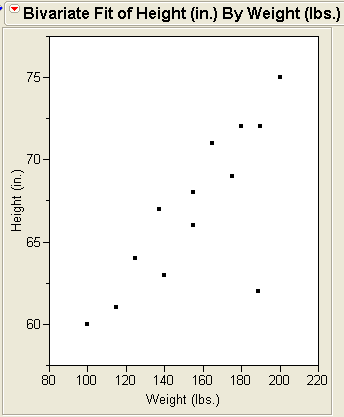
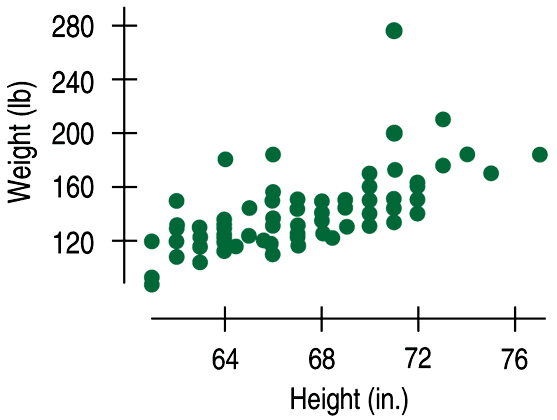
Consider data collected from students on height and weight. The scatterplot shows a positive association, and the calculated correlation is r = 0.644, indicating a moderately strong linear relationship.
Properties of Correlation
Sign: Indicates direction (positive or negative).
Range: r ranges from -1 (perfect negative) to +1 (perfect positive).
Linearity: Correlation measures only linear relationships; strong nonlinear relationships may have low r values.
Conditions for Using Correlation
Before calculating correlation, check:
Quantitative Variables Condition: Both variables must be quantitative.
Straight Enough Condition: The relationship should be approximately linear.
No Outliers Condition: Outliers can distort the value of r.
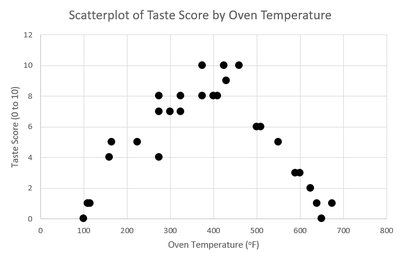
Impact of Outliers on Correlation
Outliers can make a weak correlation appear strong, or vice versa, and can even reverse the sign of the correlation. Always check for outliers and consider their impact before interpreting r.
Correlation vs. Causation
Warning: Correlation Does Not Imply Causation
A high correlation does not necessarily mean that changes in one variable cause changes in the other. There may be lurking variables or coincidences. For example, ice cream sales and shark attacks may be correlated due to a third variable (season), not causation.
How to Report Correlation
Use language that describes association, not causation.
Example: "Employees with higher salaries tend to be more productive" rather than "Raising salaries increases productivity."
Correlation Table (Correlation Matrix)
A correlation matrix displays the correlation coefficients between multiple pairs of variables, useful for multivariate data analysis.
Variable 1 | Variable 2 | Correlation |
|---|---|---|
Bodyfat | Age | 0.289124 |
Bodyfat | Weight | 0.315156 |
Age | Weight | 0.27275 |
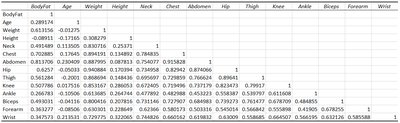
Statistically Significant Correlations
Statistical Significance of Correlation
To determine if a correlation is statistically significant, use a hypothesis test. The p-value indicates the probability that the observed correlation is due to random chance. A common threshold is 0.05; if p-value < 0.05, the correlation is considered statistically significant.
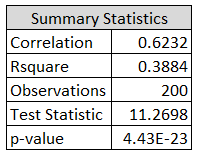
Interpreting Significance Probability
With larger datasets, even lower values of r can be statistically significant. Always consider both the strength and significance when interpreting correlation results.
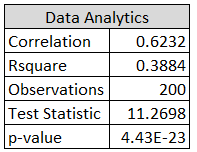
Summary
Scatterplots and correlation are essential tools for exploring relationships between quantitative variables. Understanding direction, form, strength, and unusual features in scatterplots, and properly interpreting correlation coefficients, are foundational skills in introductory statistics. Always remember that correlation does not imply causation, and statistical significance should be assessed before drawing conclusions.
