 Back
Scatterplots, Association, and Correlation: Understanding Relationships Between Quantitative Variables
Study Guide - Smart Notes
 Tailored notes based on your materials, expanded with key definitions, examples, and context.
Scatterplots, Association, and Correlation
Introduction to Scatterplots and Association
Scatterplots are graphical displays that show the relationship between two quantitative variables. Each point on the plot represents an individual data pair. By examining the pattern of points, we can describe the association between the variables in terms of direction, form, and strength.
Direction: Indicates whether the variables tend to increase together (positive association) or one increases as the other decreases (negative association).
Form: Describes the shape of the relationship (e.g., linear, curved, or no pattern).
Strength: Refers to how closely the points follow a clear form.
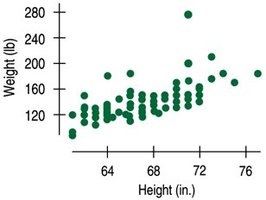
Example: The scatterplot above shows a positive association between students' heights and weights, with a fairly straight form and a possible outlier.
Correlation: Measuring Linear Association
The correlation coefficient, denoted as r, is a numerical measure of the strength and direction of the linear relationship between two quantitative variables. The value of r ranges from -1 to +1:
r = +1: Perfect positive linear relationship
r = -1: Perfect negative linear relationship
r = 0: No linear relationship
Correlation does not depend on the units of measurement and is unaffected by changing the scale of either variable.

Properties of the Correlation Coefficient (r)
Range:
Direction: The sign of r indicates the direction of association (positive or negative).
Strength: The closer |r| is to 1, the stronger the linear relationship.
Symmetry: The correlation between x and y is the same as between y and x.
No Units: Correlation is a unitless measure.
Sensitivity to Outliers: Outliers can greatly affect the value of r.
Interpreting r in Context
For example, if the correlation between speed limit and average number of accidents per week is , this indicates a very strong, positive, linear relationship between the two variables.
Calculating the Correlation Coefficient
The formula for the sample correlation coefficient is:
are the individual data values
are the sample means
are the sample standard deviations
is the number of data pairs
Correlation Conditions
Before using correlation, check these conditions:
Quantitative Variables Condition: Both variables must be quantitative (not categorical).
Straight Enough Condition: The relationship should be linear. If not, correlation may be misleading.
Outlier Condition: Outliers can distort correlation. Consider reporting correlation with and without outliers.
Examples of Correlation Strength
Strong Correlation: Points closely follow a straight line (e.g., for fat and calories in burgers).
Moderate Correlation: Points show a general linear trend but with more scatter.
Weak Correlation: Points are loosely scattered with little linear trend.
No Correlation: No discernible linear pattern.
Using Technology to Calculate Correlation
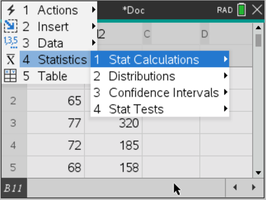
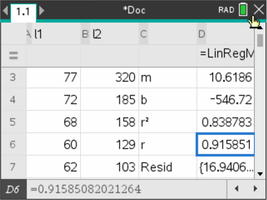
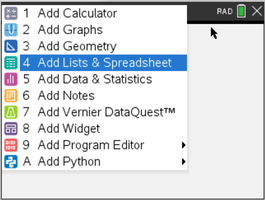
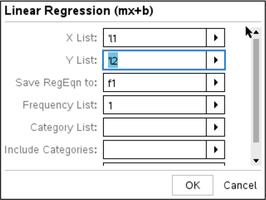
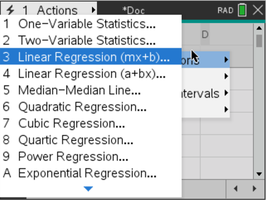
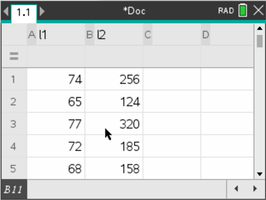
Statistical software and calculators can compute the correlation coefficient efficiently. The following images show steps for entering data and performing linear regression to obtain r:
Examples
Example 1: Heights and Weights There is a positive association between students' heights and weights, with a correlation of indicating a moderate linear relationship.
Example 2: Fat and Calories in Burgers Correlation of shows a strong, positive, linear relationship between fat content and calories in fast food hamburgers.
Straightening Scatterplots
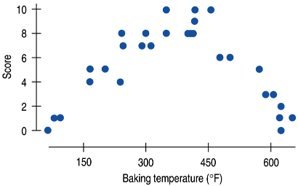
Correlation measures only linear relationships. If a scatterplot shows a curved (nonlinear) pattern, re-expressing one or both variables (e.g., using logarithms or square roots) can sometimes straighten the relationship, making correlation an appropriate measure.
Common Pitfalls and Misinterpretations
Correlation vs. Association: Use "correlation" only for linear relationships between quantitative variables. "Association" is a broader term that includes nonlinear and categorical relationships.
Do Not Correlate Categorical Variables: Correlation is not appropriate for categorical data.
Check for Linearity: A strong association may exist even if the relationship is not linear, but correlation will not capture this.
Beware of Outliers: Outliers can dramatically change the value of r.
Correlation Does Not Imply Causation
It is crucial to remember that a strong correlation between two variables does not mean that one causes the other. There may be other factors (lurking variables) influencing both variables, or the relationship may be coincidental.
Example: The number of ice cream cones sold and the number of shark attacks may be correlated, but eating ice cream does not cause shark attacks. Both may be related to a lurking variable such as temperature or season.
Example: The number of cans of diet soda consumed and the number of accidents may be correlated, but this does not imply causation.
Lurking Variables
A lurking variable is a hidden variable that affects both variables under study, potentially creating a spurious association. Always consider the possibility of lurking variables when interpreting correlation.
Summary Table: Correlation Properties and Conditions
Property/Condition | Description |
|---|---|
Range of r | -1 to +1 |
Direction | Sign of r (+ or -) |
Strength | Closer to |1| is stronger |
Symmetry | r(x, y) = r(y, x) |
No Units | Unitless measure |
Quantitative Variables | Both variables must be quantitative |
Straight Enough Condition | Relationship should be linear |
Outlier Condition | Outliers can distort r |
Lurking Variables | May create spurious correlation |
Additional info: This guide covers the essentials of scatterplots, association, and correlation, including calculation, interpretation, and common pitfalls, as relevant to introductory statistics.
