 Back
Scatterplots, Correlation, and Regression: Exploring Relationships in Data
Study Guide - Smart Notes
 Tailored notes based on your materials, expanded with key definitions, examples, and context.
Scatterplots, Correlation, and Regression
Introduction to Paired Data Analysis
In statistics, analyzing paired data helps us understand the relationship between two quantitative variables. This section introduces the concepts of correlation, scatterplots, and regression, which are essential tools for visualizing and quantifying associations between variables.
Correlation
Definition and Types of Correlation
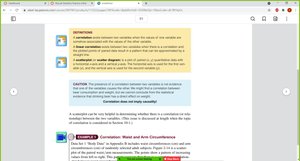
Correlation exists when the values of one variable are associated with the values of another variable.
Linear correlation occurs when the relationship between two variables can be approximated by a straight line.
Correlation can be positive, negative, or nonexistent:
Positive correlation: As one variable increases, the other tends to increase.
Negative correlation: As one variable increases, the other tends to decrease.
No correlation: No discernible pattern between the variables.
Scatterplots
Definition and Construction
A scatterplot (or scatter diagram) is a graphical representation of paired quantitative data. The horizontal axis (x-axis) represents the first variable, and the vertical axis (y-axis) represents the second variable. Each point on the plot corresponds to a pair of values.
Interpreting Scatterplots
A distinct pattern (such as a line or curve) suggests a correlation between the variables.
A random, patternless distribution of points suggests no correlation.
Examples
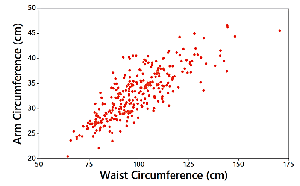
Waist and Arm Circumference: The scatterplot shows a clear upward trend, indicating a positive correlation.
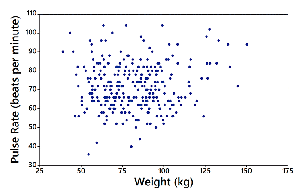
Weight and Pulse Rate: The scatterplot shows no clear pattern, indicating no correlation.
Linear Correlation Coefficient (r)
Definition and Interpretation
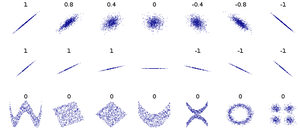
The linear correlation coefficient, denoted by r, measures the strength and direction of the linear relationship between two variables. The value of r ranges from -1 to 1:
r = 1: Perfect positive linear correlation
r = -1: Perfect negative linear correlation
r = 0: No linear correlation
Values close to 1 or -1 indicate strong correlation; values near 0 indicate weak or no correlation.
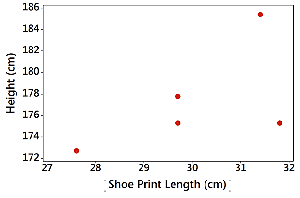
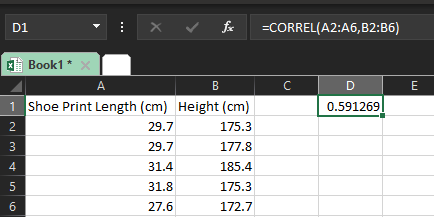
Example: Shoe Print Length and Height
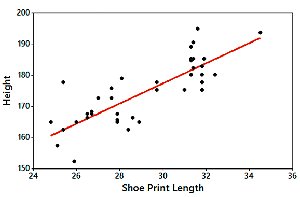
Scatterplots and calculations can be used to assess the correlation between shoe print length and height.
Regression
Definition and Purpose
Regression analysis involves finding the equation of the line (regression line or line of best fit) that best describes the relationship between two variables. This line can be used to make predictions.
The general form of the regression equation is:
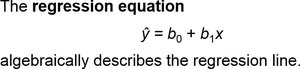
\( \hat{y} \): Predicted value of the dependent variable
\( b_0 \): y-intercept
\( b_1 \): Slope of the regression line
Creating a Regression Table in Excel
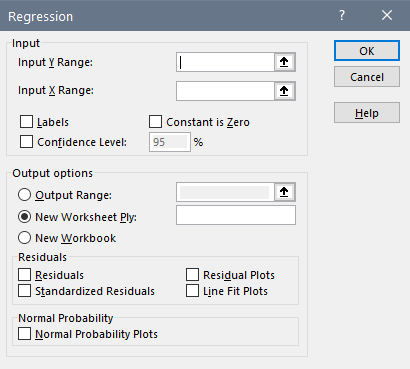
Excel provides tools for performing regression analysis:
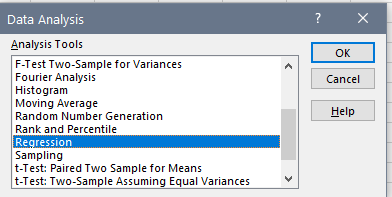
Select the "Data" tab.
Click "Data Analysis" and choose "Regression" from the list.
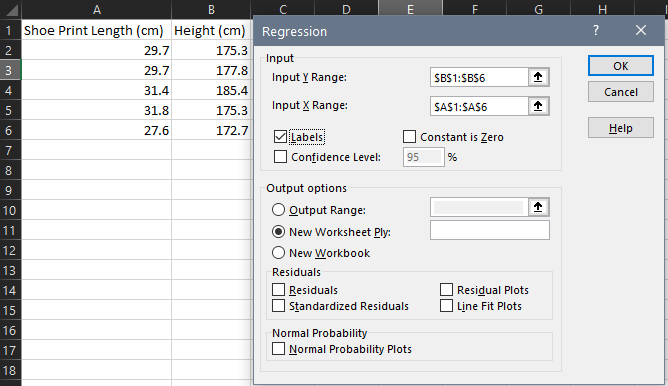
Specify the input ranges for the dependent (Y) and independent (X) variables.
Check "Labels" if your data includes headers.
Click "OK" to generate the regression output.

Regression Output Table
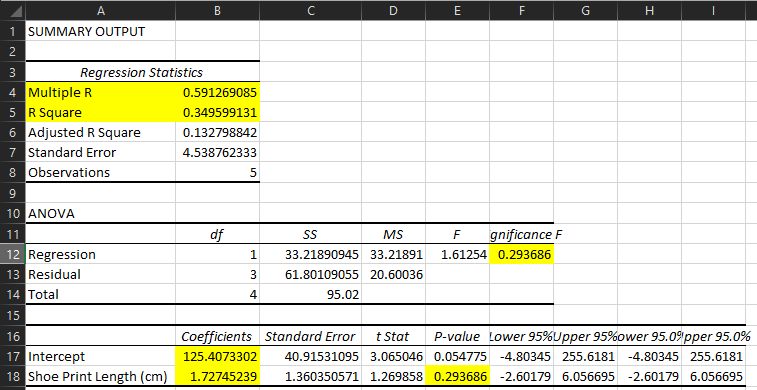
The regression output includes key statistics such as the correlation coefficient, R-squared, coefficients, and p-values.
Statistic | Description |
|---|---|
Multiple R | Correlation coefficient (r) |
R Square | Proportion of variance explained by the model |
Coefficients | Intercept and slope of the regression line |
P-value | Significance of the relationship |
P-Value in Correlation and Regression
Definition and Interpretation
The p-value helps determine whether the observed correlation is statistically significant. It represents the probability of obtaining a correlation as extreme as the observed one, assuming no real association exists.
If p-value < 0.05: Strong evidence of a linear correlation.
If p-value ≥ 0.05: No strong evidence of a linear correlation.
For example, a p-value of 0.294 suggests a high probability that the observed correlation could occur by chance, indicating no significant linear relationship.
Examples and Applications
Example: Shoe Print Length and Height (n = 40)
A larger dataset provides more reliable results. The scatterplot and regression analysis show a strong positive correlation (r = 0.813, p-value < 0.0001), indicating a significant linear relationship between shoe print length and height.
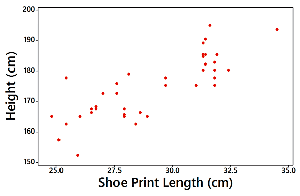
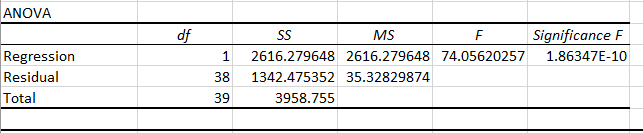
Regression Line Example
The regression equation for predicting height from shoe print length is:
Summary Table: Key Terms and Concepts
Term | Definition |
|---|---|
Correlation | Association between two variables |
Scatterplot | Graph of paired data |
Linear Correlation Coefficient (r) | Measures strength and direction of linear relationship |
Regression Line | Best-fit line for predicting one variable from another |
P-value | Probability of observing the data if no real association exists |
