 Back
BackSection 9.2 – Linear Regression: Regression Lines, Residuals, and Prediction
Study Guide - Smart Notes
 Tailored notes based on your materials, expanded with key definitions, examples, and context.
Linear Regression
Introduction to Linear Regression
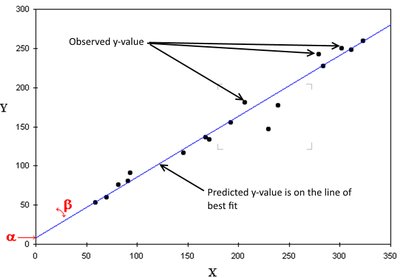
Linear regression is a statistical method used to model the relationship between two quantitative variables by fitting a straight line (the regression line) to the observed data. The goal is to minimize the differences between the observed values and the values predicted by the line.
Regression line (line of best fit): A straight line that best describes how the response variable y changes as the explanatory variable x changes.
Equation of the regression line:
ŷ (y-hat): Predicted value of y for a given x-value.
m: Slope of the line (rate of change of y with respect to x).
b: y-intercept (value of y when x = 0).
Additional info: The regression line is determined using all data points, not just two as in algebra. It is used for prediction only when there is a significant correlation between x and y.
Residuals
Residuals measure the vertical distance between the observed y-values and the predicted y-values on the regression line. They indicate how well the regression line fits the data.
Residual (d):
A small residual means the prediction is accurate; a large residual means the prediction is less accurate.
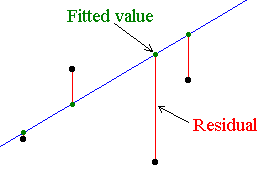
Additional info: Residuals are used to assess the goodness of fit of the regression model. The best-fitting line minimizes the sum of the squared residuals.
Interpreting the Regression Line
The regression line is meaningful only when the correlation between x and y is strong or significant. The sign of the slope (m) indicates the direction of the relationship:
Positive slope: Indicates a positive linear correlation (as x increases, y increases).
Negative slope: Indicates a negative linear correlation (as x increases, y decreases).
Predictions using the regression line are only meaningful for x-values within the range of the original data (interpolation). Predictions outside this range (extrapolation) are generally unreliable.
Formulas for the Regression Line
To find the regression line, follow these steps:
Find the slope (m):
Find the y-intercept (b):
Write the regression equation:
When substituting values for m and b, round to the thousandths place.
Using the Regression Equation for Prediction
To predict the value of y for a given x-value, substitute x into the regression equation. Ensure that the x-value is within the range of the original data for the prediction to be meaningful.
If x is outside the range, state: "It is not meaningful to predict the value of y for x = (value) because x = (value) is outside the range of the original data."
Worked Example: Regression Line Calculation
Given data: Heights (x) and number of stories (y) for nine buildings in Atlanta.
Find the slope (m):
Find the y-intercept (b):
Regression equation:
Prediction Example
For x = 800 feet: (meaningful, since 800 is within the data range)
For x = 400 feet: Not meaningful, since 400 is outside the data range (486 to 869).
Correlation Coefficient (from Section 9.1)
The sample correlation coefficient r measures the strength and direction of the linear relationship between x and y.
Interpretation: r close to 1 or -1 indicates a strong linear relationship; r close to 0 indicates a weak relationship.
Summary Table: Steps for Finding the Regression Line
Step | Description | Formula |
|---|---|---|
1 | Find the slope (m) | |
2 | Find the y-intercept (b) | |
3 | Write the regression equation | |
4 | Predict y for a given x | Substitute x into |
