 Back
BackSTA 1001 Final Exam Review – Step-by-Step Statistics Guidance
Study Guide - Smart Notes
 Tailored notes based on your materials, expanded with key definitions, examples, and context.
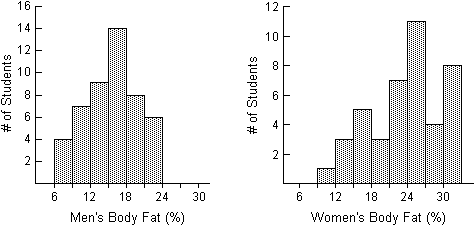
Q11. Do the female or male students have a larger standard deviation? Justify your answer.
Background
Topic: Measures of Spread (Standard Deviation)
This question asks you to compare the variability (spread) of body fat percentages between two groups (male and female students) using histograms. Standard deviation is a measure of how spread out the values in a data set are around the mean.
Key Terms and Formulas:
Standard Deviation (): A measure of the average distance of each data point from the mean.
Histogram: A graphical representation showing the distribution of a dataset.
Spread: The extent to which data values vary.
The formula for sample standard deviation is:
= each data value
= sample mean
= sample size
Step-by-Step Guidance
Examine the width of the distribution for each group in the histograms. A wider spread indicates a larger standard deviation.
Look for the range of values (difference between the smallest and largest values) for both groups. The group with a larger range often has a larger standard deviation.
Notice the shape of the distribution. If one group has more values farther from the mean (more spread out), its standard deviation will be larger.
Compare the clustering of data. If one histogram shows data more tightly clustered around the mean, it will have a smaller standard deviation.
Try solving on your own before revealing the answer!
Final Answer: Female students have a larger standard deviation.
The histogram for women’s body fat percentages is more spread out, covering a wider range of values, while the men’s data is more concentrated. This greater spread means a larger standard deviation for the female students.
