 Back
BackSTA 2023 Ch 8-9 Test Review: Hypothesis Testing, Confidence Intervals, and Proportions
Study Guide - Smart Notes
 Tailored notes based on your materials, expanded with key definitions, examples, and context.
Q1. Statistical ______________ is the process for using a measurement taken from a _______________ to draw some meaningful conclusion about a ________________.
Background
Topic: Statistical Inference
This question tests your understanding of the basic process in statistics where we use sample data to make conclusions about a larger population.
Key Terms:
Inference: Drawing conclusions about a population based on sample data.
Sample: A subset of the population used for measurement.
Population: The entire group about which we want to draw conclusions.
Step-by-Step Guidance
Recall that statistics often involves collecting data from a sample.
Think about how we use this sample data to make statements about the population.
Identify the process that describes this method.
Try solving on your own before revealing the answer!
Q2. The _____________ hypothesis always has an equal sign ( "=" ) in it.
Background
Topic: Null and Alternative Hypotheses
This question is about the structure of hypotheses in statistical testing.
Key Terms:
Null Hypothesis (): The default assumption, usually stating no effect or no difference.
Alternative Hypothesis (): The competing claim, often stating there is an effect or difference.
Step-by-Step Guidance
Recall the notation and meaning of the null hypothesis.
Think about which hypothesis uses the "=" sign.
Consider the role of the alternative hypothesis in comparison.
Try solving on your own before revealing the answer!
Q3. If the p-value is greater than the significance level, then we should ______________ the null hypothesis.
Background
Topic: Decision Rule in Hypothesis Testing
This question tests your understanding of how to interpret p-values in relation to the significance level ().
Key Terms:
p-value: The probability of observing a result as extreme as, or more extreme than, the one observed, assuming the null hypothesis is true.
Significance Level (): The threshold for rejecting the null hypothesis, commonly set at 0.05.
Step-by-Step Guidance
Compare the p-value to the significance level ().
If the p-value is greater, what does that mean about the evidence against the null hypothesis?
Recall the standard decision rule for hypothesis testing.
Try solving on your own before revealing the answer!
Q4. State the null hypothesis for the die scenario.
Background
Topic: Hypothesis Testing for Proportions
This question asks you to set up the null hypothesis for a claim about a proportion (probability of rolling an even number).
Key Terms:
Null Hypothesis (): The default claim, usually stating no effect or no difference.
Proportion (): The probability of rolling an even number on a fair six-sided die.
Step-by-Step Guidance
Identify the proportion of even numbers on a fair die (3 out of 6 sides).
Express the null hypothesis in terms of .
Use the "=" sign in the null hypothesis.
Try solving on your own before revealing the answer!
Q5. State the alternative hypothesis for the die scenario.
Background
Topic: Hypothesis Testing for Proportions
This question asks you to set up the alternative hypothesis for the claim that the die lands on an even number more than 50% of the time.
Key Terms:
Alternative Hypothesis (): The claim being tested, often stating there is an effect or difference.
Proportion (): The probability of rolling an even number.
Step-by-Step Guidance
Identify the claim: more than 50% of the time.
Express the alternative hypothesis in terms of .
Use the ">" sign in the alternative hypothesis.
Try solving on your own before revealing the answer!
Q6. If an observed value has a _______________ p-value, this would discredit the null hypothesis.
Background
Topic: Interpreting p-values
This question tests your understanding of what kind of p-value leads to rejecting the null hypothesis.
Key Terms:
p-value: The probability of observing a result as extreme as the one observed, assuming the null hypothesis is true.
Step-by-Step Guidance
Recall the decision rule: compare p-value to significance level.
Think about what kind of p-value leads to rejection of the null hypothesis.
Fill in the blank with the appropriate descriptor.
Try solving on your own before revealing the answer!
Q7. Sketch the z-test statistic and shade the appropriate area that represents the p-value.
Background
Topic: Visualizing Hypothesis Tests
This question asks you to represent the z-test statistic and the p-value on a normal distribution curve.
Key Terms:
z-test statistic: A measure of how many standard deviations the observed proportion is from the hypothesized proportion.
p-value: The area under the curve in the tail(s) corresponding to the test statistic.
Step-by-Step Guidance
Draw a normal distribution curve.
Mark the location of the z-test statistic (e.g., ) on the horizontal axis.
Shade the area to the right of the z-test statistic to represent the p-value for a one-sided test.
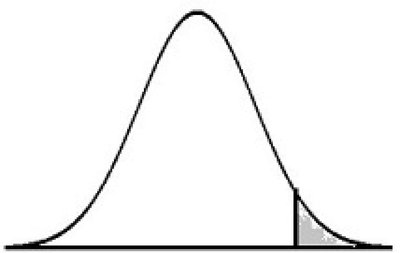
Try solving on your own before revealing the answer!
Q8. The p-value is found to be 0.030. Fill in the blanks: Because the p-value is _______________ the significance level, we __________________ the null hypothesis. There _________________ enough evidence to show that the population proportion _________________ 0.20
Background
Topic: Interpreting Results of Hypothesis Tests
This question tests your ability to interpret the outcome of a hypothesis test based on the p-value and significance level.
Key Terms:
p-value
Significance level ()
Reject or fail to reject the null hypothesis
Step-by-Step Guidance
Compare the p-value (0.030) to the significance level (0.05).
Determine whether to reject or fail to reject the null hypothesis.
Fill in the blanks to summarize the evidence regarding the population proportion.
Try solving on your own before revealing the answer!
