 Back
BackSTA 2023 Ch 8-9 Test Review: Hypothesis Testing, Confidence Intervals, and Proportions
Study Guide - Smart Notes
 Tailored notes based on your materials, expanded with key definitions, examples, and context.
Q1. Statistical ______________ is the process for using a measurement taken from a _______________ to draw some meaningful conclusion about a ________________.
Background
Topic: Statistical Inference
This question is testing your understanding of the basic process in statistics where we use sample data to make conclusions about a larger population.
Key Terms:
Inference: Drawing conclusions about a population based on sample data.
Sample: A subset of the population used to collect data.
Population: The entire group we want to learn about.
Step-by-Step Guidance
Recall that statistics often involves collecting data from a sample.
Think about how we use this sample data to make statements about the population.
Fill in the blanks with the terms that describe this process.
Try solving on your own before revealing the answer!
Final Answer: inference, sample, population
Statistical inference is the process for using a measurement taken from a sample to draw some meaningful conclusion about a population.
Q2. The _____________ hypothesis always has an equal sign ( "=" ) in it.
Background
Topic: Null and Alternative Hypotheses
This question is testing your knowledge of hypothesis testing terminology.
Key Terms:
Null Hypothesis (): The statement being tested, usually representing no effect or no difference.
Alternative Hypothesis (): The statement we are trying to find evidence for.
Step-by-Step Guidance
Recall the structure of hypotheses in statistics.
Think about which hypothesis is written with an equality sign.
Fill in the blank with the correct term.
Try solving on your own before revealing the answer!
Final Answer: Null
The null hypothesis always has an equal sign ("=") in it.
Q3. If the p-value is greater than the significance level, then we should ______________ the null hypothesis.
Background
Topic: Decision Rule in Hypothesis Testing
This question is about the rule for making decisions based on the p-value and significance level ().
Key Terms:
p-value: The probability of observing a result as extreme as, or more extreme than, the one observed, assuming the null hypothesis is true.
Significance Level (): The threshold for rejecting the null hypothesis, commonly set at 0.05.
Null Hypothesis (): The hypothesis we test against.
Step-by-Step Guidance
Compare the p-value to the significance level ().
If the p-value is greater than , what does that mean about the evidence against ?
Fill in the blank with the correct decision.
Try solving on your own before revealing the answer!
Final Answer: fail to reject
If the p-value is greater than the significance level, we fail to reject the null hypothesis.
Q4. State the null hypothesis for the die scenario.
Background
Topic: Hypothesis Testing for Proportions
This question is about setting up hypotheses for a proportion test. The claim is that a die lands on an even number more than 50% of the time.
Key Terms:
Null Hypothesis (): The default assumption, usually representing no effect or no difference.
Proportion (): The probability of an event occurring.
Step-by-Step Guidance
Identify the claim being tested: "more than 50%".
The null hypothesis should represent the status quo or no effect.
Write the null hypothesis in terms of the proportion .
Try solving on your own before revealing the answer!
Final Answer:
The null hypothesis is that the proportion of even numbers is 0.50.
Q5. State the alternative hypothesis for the die scenario.
Background
Topic: Hypothesis Testing for Proportions
This question is about stating the alternative hypothesis, which reflects the claim being tested.
Key Terms:
Alternative Hypothesis (): The hypothesis that represents the claim or effect.
Proportion (): The probability of an event occurring.
Step-by-Step Guidance
Recall the claim: "more than 50%".
The alternative hypothesis should reflect this claim.
Write the alternative hypothesis in terms of the proportion .
Try solving on your own before revealing the answer!
Final Answer:
The alternative hypothesis is that the proportion of even numbers is greater than 0.50.
Q6. If an observed value has a _______________ p-value, this would discredit the null hypothesis.
Background
Topic: Interpreting p-values
This question is about understanding what kind of p-value leads to rejecting the null hypothesis.
Key Terms:
p-value: The probability of observing a result as extreme as, or more extreme than, the one observed, assuming the null hypothesis is true.
Null Hypothesis (): The hypothesis we test against.
Step-by-Step Guidance
Recall the rule for rejecting the null hypothesis: p-value < significance level ().
Think about what kind of p-value would lead to rejection.
Fill in the blank with the correct term.
Try solving on your own before revealing the answer!
Final Answer: small
A small p-value would discredit the null hypothesis.
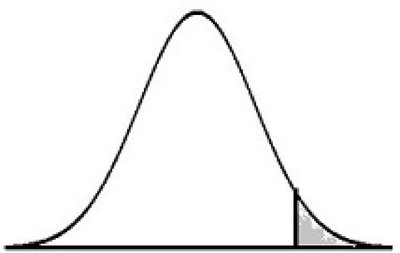
Q7. Sketch the z-test statistic and shade the appropriate area that represents the p-value.
Background
Topic: Visualizing Hypothesis Tests
This question is about understanding how the z-test statistic relates to the p-value on a normal distribution curve.
Key Terms:
z-test statistic: A measure of how many standard deviations an observed value is from the mean.
p-value: The area under the curve in the tail(s) beyond the test statistic.
Step-by-Step Guidance
Recall that the z-test statistic is plotted on the horizontal axis of the normal curve.
The p-value is the area under the curve to the right (for a one-sided test) of the z-test statistic.
Shade the area under the curve that represents the p-value.
Try solving on your own before revealing the answer!
Final Answer: The shaded area to the right of the z-test statistic represents the p-value.
For a one-sided test, the p-value is the area under the curve in the tail beyond the z-test statistic.
Q8. The p-value is found to be 0.030. Fill in the blanks: Because the p-value is _______________ the significance level, we __________________ the null hypothesis. There _________________ enough evidence to show that the population proportion _________________ 0.20
Background
Topic: Interpreting p-values and Drawing Conclusions
This question is about making decisions based on the p-value and significance level, and interpreting the result in context.
Key Terms:
p-value: The probability of observing a result as extreme as, or more extreme than, the one observed, assuming the null hypothesis is true.
Significance Level (): The threshold for rejecting the null hypothesis.
Null Hypothesis (): The hypothesis we test against.
Population Proportion (): The proportion in the population.
Step-by-Step Guidance
Compare the p-value (0.030) to the significance level (0.05).
Decide whether to reject or fail to reject the null hypothesis.
Interpret what this means about the population proportion compared to 0.20.
Try solving on your own before revealing the answer!
Final Answer: less than, reject, is, is greater than
Because the p-value is less than the significance level, we reject the null hypothesis. There is enough evidence to show that the population proportion is greater than 0.20.
