 Back
STA2023 Introductory Statistics Syllabus & Study Guide
Study Guide - Smart Notes
 Tailored notes based on your materials, expanded with key definitions, examples, and context.
Course Overview
Introduction to STA2023: Statistics
STA2023 is an introductory statistics course designed for college students across various disciplines. The course covers fundamental statistical methods, including data collection, descriptive and inferential statistics, probability, distributions, hypothesis testing, and regression analysis. Students will use technology, such as statistical software and graphing calculators, to enhance their understanding and application of statistical concepts.
Course Topics & Structure
Major Topics Covered
Collecting, Grouping, and Presenting Data: Methods for gathering and organizing data, including frequency distributions and graphical representations.
Descriptive Statistics: Measures of central tendency (mean, median, mode, midrange), variation (range, standard deviation, variance), and relative standing (z-scores, quartiles, percentiles).
Probability: Fundamental rules, addition and multiplication rules, complements, conditional probability, and counting principles.
Probability Distributions: Discrete and binomial distributions, calculation of mean and standard deviation for distributions.
Normal Distribution & Central Limit Theorem: Properties of the normal distribution, applications, and the central limit theorem for sample means.
Estimation & Confidence Intervals: Point and interval estimates for population parameters, including mean and proportion.
Hypothesis Testing: Structure and concepts of hypothesis testing for one and two samples, including tests for means and proportions.
Correlation & Regression: Calculation and interpretation of the correlation coefficient, linear regression, and prediction based on data.
Course Calendar & Chapter Mapping
Weekly Topics and Chapter Alignment
Date | Section/Topic | Chapter Mapping |
|---|---|---|
Aug. 25 | Overview/Types of Data | Chapter 1: Intro to Stats and Collecting Data |
Aug. 27 | Types of Data/Frequency Distributions | Chapter 2: Describing Data with Tables and Graphs |
Sept. 1 | Histograms | Chapter 2 |
Sept. 3 | Stemplots | Chapter 2 |
Sept. 8 | Measures of Center | Chapter 3: Describing Data Numerically |
Sept. 10 | Measures of Variation | Chapter 3 |
Sept. 15 | Measures of Relative Standing | Chapter 3 |
Sept. 22-29 | Probability Fundamentals, Rules, Complements, Conditional Probability | Chapter 4: Probability |
Oct. 1-8 | Counting, Probability Distributions, Binomial Distribution | Chapter 5: Binomial Distribution & Discrete Random Variables |
Oct. 15-27 | Standard Normal Distribution, Applications, Central Limit Theorem | Chapter 6: Normal Distribution and Continuous Random Variables |
Oct. 29-Nov. 3 | Estimating Population Proportion & Mean | Chapters 7 & 8: Sampling Distributions & Confidence Intervals |
Nov. 10-24 | Hypothesis Testing (Proportion, Mean, Two Means) | Chapters 9 & 10: Hypothesis Testing for One and Two Samples |
Dec. 1-8 | Correlation & Regression | Chapters 11 & 12: Correlation and Regression |
Key Statistical Concepts
Descriptive Statistics
Descriptive statistics summarize and describe the main features of a dataset. Common measures include:
Mean: The average value, calculated as
Median: The middle value when data are ordered.
Mode: The most frequently occurring value.
Range: The difference between the maximum and minimum values.
Standard Deviation: Measures the spread of data,
Variance: The square of the standard deviation.
Z-score: Indicates how many standard deviations a value is from the mean,
Probability
Probability quantifies the likelihood of events occurring. Key rules include:
Addition Rule:
Multiplication Rule:
Complement Rule:
Conditional Probability:
Probability Distributions
Probability distributions describe how probabilities are distributed over values of a random variable. The binomial distribution is a common discrete distribution:
Binomial Probability:
Mean of Binomial:
Standard Deviation of Binomial:
Normal Distribution & Central Limit Theorem
The normal distribution is a continuous, symmetric distribution characterized by its mean and standard deviation. The central limit theorem states that the sampling distribution of the sample mean approaches a normal distribution as sample size increases.
Standard Normal Distribution:
Central Limit Theorem: For large , is approximately normal with and
Estimation & Confidence Intervals
Estimation involves determining population parameters using sample statistics. Confidence intervals provide a range of values likely to contain the parameter.
Confidence Interval for Mean:
Confidence Interval for Proportion:
Hypothesis Testing
Hypothesis testing is a formal procedure for testing claims about population parameters. It involves stating null and alternative hypotheses, selecting a significance level, and using test statistics to make decisions.
Test Statistic for Mean:
Test Statistic for Proportion:
Correlation & Regression
Correlation measures the strength and direction of a linear relationship between two variables. Regression predicts values based on the relationship.
Correlation Coefficient:
Regression Equation:
Course Requirements & Grading
Assessment Structure
Homework: Assigned via MyLab Statistics, due before each test.
Tests: Four major tests covering grouped chapters.
Grading Scale:
537-600 Points: A
477-536 Points: B
417-476 Points: C
357-416 Points: D
0-356 Points: F
Student Support & Resources
Academic and Mental Health Support
Math Lab & Academic Success Center: Tutoring, study groups, calculator access, and more.
Brainfuse: 24/7 online tutoring for statistics and other subjects.
Mental Health Services: Free counseling and support for all students.
Important Policies
Attendance, Academic Honesty, and Accommodations
Attendance: Required for all classes; excessive absences may result in failure.
Academic Honesty: Strict policy against cheating, plagiarism, and unauthorized collaboration.
Accommodations: Support for students with disabilities is available upon request.
Textbook & Materials
Required Materials
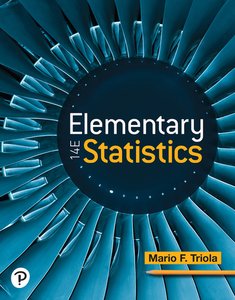
Elementary Statistics by Mario F. Triola, 14th Edition (Pearson)
MyLab Statistics Access Code
TI-83 or TI-84 Graphing Calculator
Summary Table: Chapter Topics
Chapter | Topic |
|---|---|
1 | Intro to Stats and Collecting Data |
2 | Describing Data with Tables and Graphs |
3 | Describing Data Numerically |
4 | Probability |
5 | Binomial Distribution & Discrete Random Variables |
6 | Normal Distribution and Continuous Random Variables |
7 | Sampling Distributions & Confidence Intervals: Mean |
8 | Sampling Distributions & Confidence Intervals: Proportion |
9 | Hypothesis Testing for One Sample |
10 | Hypothesis Testing for Two Samples |
11 | Correlation |
12 | Regression |
Additional info: The syllabus aligns closely with the standard introductory statistics curriculum, covering all major topics listed in the reference chapter titles. The course calendar and outcomes provide a clear structure for exam preparation and study.
