 Back
BackStandardization, Normal Models, and Sampling in Statistics
Study Guide - Smart Notes
 Tailored notes based on your materials, expanded with key definitions, examples, and context.
Z-Scores and Standardization
Definition and Calculation of Z-Scores
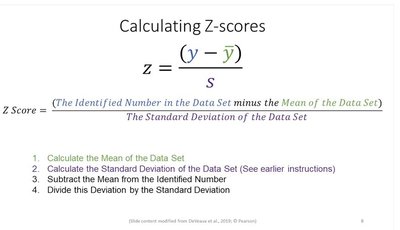
Z-scores are used to standardize data, allowing comparison across different distributions by expressing values in terms of their distance from the mean, measured in standard deviations. The z-score formula is:
Formula:
Steps:
Calculate the mean of the data set.
Calculate the standard deviation of the data set.
Subtract the mean from the identified number.
Divide this deviation by the standard deviation.
Interpretation: Larger absolute z-scores indicate more uncommon values; z-scores can be positive or negative depending on whether the value is above or below the mean.
Properties of Z-Scores
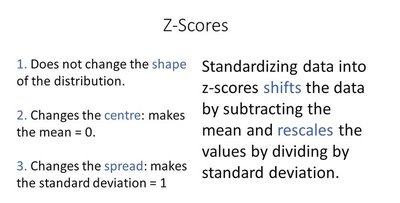
Standardizing data into z-scores does not change the shape of the distribution, but it shifts and rescales the data:
Shape: Remains unchanged.
Center: Mean becomes 0.
Spread: Standard deviation becomes 1.
Density Curves and the Normal Model
Density Curves
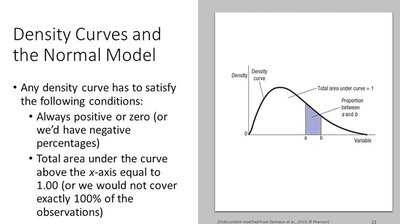
Density curves are smooth curves drawn over histograms to model the distribution of data. They must satisfy:
Always positive or zero: The curve never dips below the x-axis.
Total area under the curve: Must equal 1, representing 100% of the data.
The Normal Model
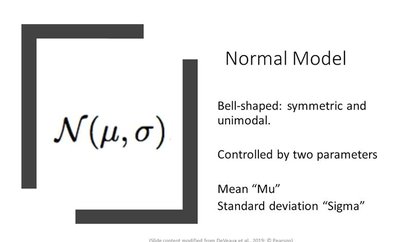
The normal model is a specific type of density curve that is bell-shaped, symmetric, and unimodal. It is defined by two parameters:
Mean (\mu): Determines the center of the curve.
Standard deviation (\sigma): Controls the spread; smaller \sigma results in a narrower curve.
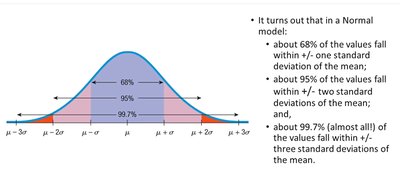
68-95-99.7 Rule
The normal model follows the empirical rule:
About 68% of values fall within ±1 standard deviation of the mean.
About 95% fall within ±2 standard deviations.
About 99.7% fall within ±3 standard deviations.
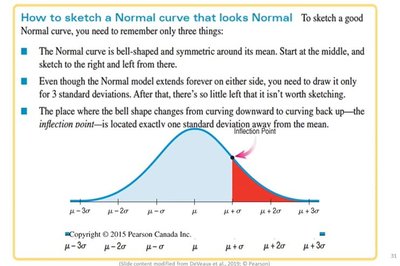
Sketching the Normal Curve
To sketch a normal curve:
Start at the mean, which is the center.
Draw the curve symmetrically for three standard deviations on either side.
The inflection point is one standard deviation from the mean.
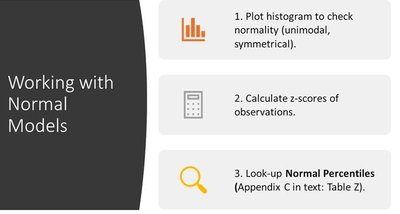
Working with Normal Models
Steps for Analysis
When working with normal models:
Plot a histogram to check for normality (unimodal, symmetrical).
Calculate z-scores for observations.
Look up normal percentiles using statistical tables.
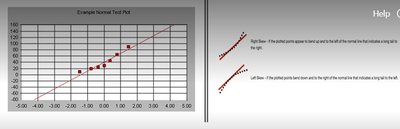
Normal Probability Plots
Normal probability plots are used to check the assumption of normality:
Plot z-scores on the horizontal axis.
If the data forms a straight line, it is approximately normal.
Curved plots indicate skewness: upward to the left (right-skewed), downward to the right (left-skewed).
Sampling and Surveys
Sample Surveys and Sampling Principles
Sample surveys are used to gather information about a population by examining a subset. The three key principles are:
Examine a part of the whole: A properly selected sample can represent the entire population.
Randomize: Random selection protects against bias and ensures representativeness.
Sample size: The size of the sample is more important than the fraction of the population sampled.
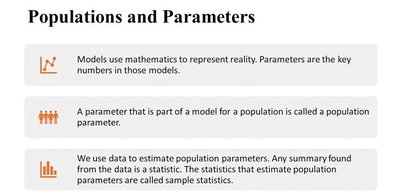
Census and Population Parameters
A census attempts to survey every individual in a population, but is often impractical. Parameters are characteristics of the population, while statistics are characteristics of the sample.
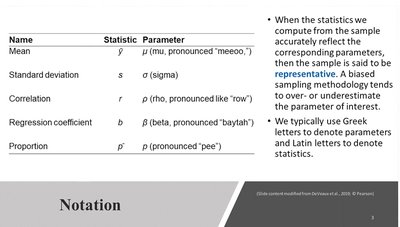
Statistical Notation
Statistics and parameters are denoted using Latin and Greek letters, respectively. The table below summarizes common notation:
Name | Statistic | Parameter |
|---|---|---|
Mean | \bar{y} | \mu |
Standard deviation | s | \sigma |
Correlation | r | \rho |
Regression coefficient | b | \beta |
Proportion | \hat{p} | p |
Sampling Strategies
The method of sampling affects the representativeness of the data:
Simple random sample: Each individual has an equal chance of being selected.
Stratified sampling: Population is divided into homogeneous groups (strata), and random samples are taken from each.
Cluster/multistage sampling: Population is split into clusters, and some clusters are sampled. Multistage sampling combines several methods.
Systematic sampling: Individuals are selected at regular intervals from a list.
Survey Validity and Common Sampling Mistakes
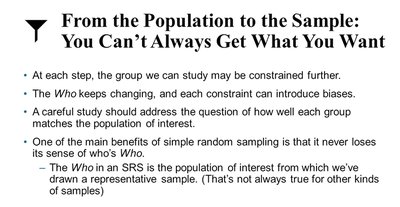
From Population to Sample
Defining the 'who' of a survey is crucial. The sampling frame, target sample, and actual respondents must be specified to avoid ambiguity and bias.
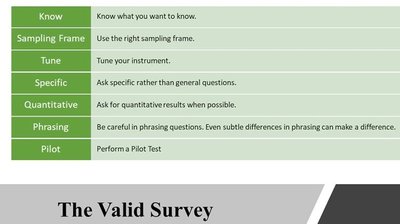
Ensuring Valid Surveys
To ensure a valid survey:
Know what you want to know.
Use the right sampling frame.
Tune your instrument.
Ask specific and quantitative questions.
Phrase questions carefully.
Perform a pilot test.
Common Sampling Mistakes
Common mistakes include:
Sampling only volunteers or conveniently available people.
Using a bad sampling frame (e.g., missing certain groups).
Undercoverage (excluding segments of the population).
Nonresponse bias (differences between respondents and nonrespondents).
Response bias (survey design influences responses).
Additional info: Always consider who could have been missed in your study and strive for equal participation opportunity.
