 Back
BackStatistical Inference and Regression Analysis: Practice with Real Data Outputs
Study Guide - Smart Notes
 Tailored notes based on your materials, expanded with key definitions, examples, and context.
Q12. Haircuts: Comparing Costs at Two Salons
Background
Topic: Inference for the Difference Between Two Means (Independent and Paired Samples)
This question is about determining whether there is a significant difference in the cost of haircuts at two different salons using sample data. It also asks you to choose the correct inference procedure, check assumptions, and interpret computer output.
Key Terms and Formulas
Two-sample t-test: Used to compare the means of two independent groups.
Paired t-test: Used when the samples are paired or matched in some way.
Assumptions: Independence, normality (or large enough sample size), and equal/unequal variances as appropriate.
Test statistic for two-sample t-test:
Test statistic for paired t-test:
Confidence Interval for Difference:
Step-by-Step Guidance
First, decide which inference procedure is appropriate. Are the samples independent (different stylists at each salon, no matching) or paired (same stylists at both salons, or some natural pairing)?
Check the assumptions for the test you choose: Are the samples random? Is the population of haircut costs approximately normal, or is the sample size large enough for the Central Limit Theorem to apply?
Write the null and alternative hypotheses for the test. For example, (no difference in mean cost), (there is a difference), or if you have a directional claim.
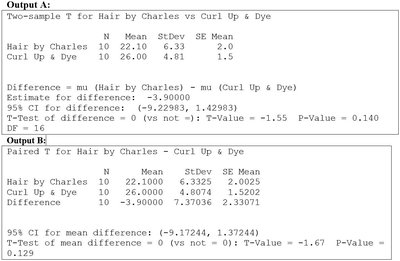
Examine the computer outputs. Output A is for a two-sample t-test (independent samples), and Output B is for a paired t-test. Match the correct output to your chosen procedure and explain why.
Use the correct output to interpret the results: Look at the confidence interval, t-value, and P-value. Consider whether the P-value is less than your significance level (often 0.05) to decide if you reject or fail to reject the null hypothesis. State your conclusion in the context of haircut costs at the two salons.
Try solving on your own before revealing the answer!
Final Answer:
The correct inference procedure is the two-sample t-test (Output A), because the samples are independent (different stylists at each salon). The P-value is 0.140, which is greater than 0.05, so there is not enough evidence to conclude a significant difference in mean haircut costs between the two salons. The confidence interval for the difference includes zero, supporting this conclusion.
Q13. Poverty: Chi-Square Test for Independence
Background
Topic: Chi-Square Test for Independence
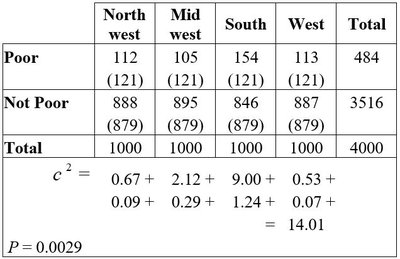
This question asks you to analyze whether the burden of poverty is independent of U.S. region using a contingency table and chi-square test.
Key Terms and Formulas
Chi-square test statistic:
Degrees of freedom:
Expected count for a cell:
P-value: Probability of observing a chi-square statistic as extreme as, or more extreme than, the one calculated, under the null hypothesis.
Step-by-Step Guidance
Write the null and alternative hypotheses. : Poverty status is independent of region. : Poverty status is not independent of region.
Calculate the degrees of freedom: .
Show how to calculate the expected count for the first cell (e.g., Poor in Northwest): .
Compare the calculated chi-square statistic to the critical value or use the P-value to determine whether to reject the null hypothesis. State your conclusion in context.
Try solving on your own before revealing the answer!
Final Answer:
There is evidence to suggest that poverty status is not independent of region (P = 0.0029). The calculated chi-square statistic is 14.01 with the appropriate degrees of freedom, and the P-value is less than 0.05, so we reject the null hypothesis.
Q14. Hospital Stays: Regression Analysis
Background
Topic: Simple Linear Regression
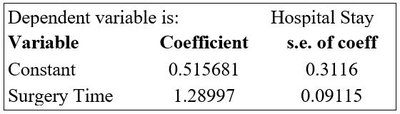
This question involves interpreting the output of a regression analysis to determine the relationship between surgery time and hospital stay length.
Key Terms and Formulas
Regression equation:
t-statistic for slope:
P-value: Probability of observing a t-statistic as extreme as, or more extreme than, the one calculated, under the null hypothesis that the slope is zero.
Step-by-Step Guidance
Identify the regression coefficients: the intercept (constant) and the slope (coefficient for surgery time).
Calculate the t-statistic for the slope: .
Determine the degrees of freedom: , where is the number of observations.
Find the P-value associated with the t-statistic to assess the significance of the relationship.
State your conclusion about the relationship between surgery time and hospital stay in context.
Try solving on your own before revealing the answer!
Final Answer:
The t-statistic for the slope is approximately 14.16, which is highly significant. This suggests a strong positive relationship between surgery time and hospital stay length.
Q15. Student Progress: Regression and Assumptions
Background
Topic: Regression Analysis and Model Assumptions
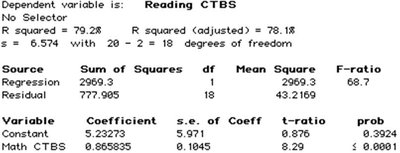
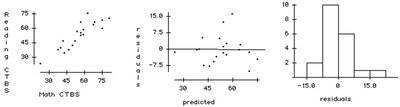
This question asks you to analyze the association between math and reading scores using regression output, scatterplot, residual plot, and histogram of residuals.
Key Terms and Formulas
Regression equation:
Assumptions for regression: Linearity, independence, normality of residuals, equal variance (homoscedasticity)
Confidence interval for slope:
Step-by-Step Guidance
State the hypotheses: : No association (slope = 0), : There is an association (slope ≠ 0).
Check the assumptions for regression using the scatterplot, residual plot, and histogram of residuals. Look for linearity, constant variance, and normality of residuals.
Interpret the regression output: Look at the coefficient for Math CTBS, its standard error, t-ratio, and P-value.
Construct a 95% confidence interval for the true slope using the formula: .
Explain what the confidence interval means in the context of the relationship between math and reading scores.
Try solving on your own before revealing the answer!
Final Answer:
The regression analysis shows a significant positive association between math and reading scores (P < 0.0001). The 95% confidence interval for the slope does not include zero, supporting the conclusion that higher math scores are associated with higher reading scores.
