 Back
BackStatistical Inference for Employee Satisfaction Index (ESI)
Study Guide - Smart Notes
 Tailored notes based on your materials, expanded with key definitions, examples, and context.
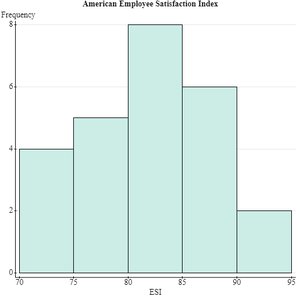
Q6. An international company is aware that the mean Employee Satisfaction Index (ESI) within its Denmark-based branches is excellent, being 90, on a scale from 0 to 100. A union representative wishes to ascertain if the same mean of 90 is achieved or not within the company’s U.S.-based branches. Here are some summary statistics and a histogram of the ESIs obtained from a random sample of 25 U.S. employees.
Background
Topic: Hypothesis Testing for Means (One-Sample t-Test)
This question tests your understanding of hypothesis testing for a population mean, including setting up hypotheses, checking assumptions, calculating test statistics and p-values, and interpreting confidence intervals. The histogram helps assess normality, which is important for the t-test.
Key Terms and Formulas
Null Hypothesis (): The mean ESI in U.S. branches is 90 ().
Alternative Hypothesis (): The mean ESI in U.S. branches is not 90 ().
Test Statistic:
Confidence Interval:
Assumptions: Random sample, approximately normal distribution (check histogram), independence.
Step-by-Step Guidance
Write the null and alternative hypotheses:
Check assumptions: Is the sample random? Is the sample size large enough or is the data approximately normal? Use the histogram to assess normality.
Calculate the test statistic using the formula: Where , , , .
Find the p-value associated with your calculated t-statistic using the t-distribution with degrees of freedom.
Construct a 95% confidence interval for the mean ESI using: Where is the critical value for 95% confidence and 24 degrees of freedom.
Try solving on your own before revealing the answer!
Final Answer:
1. Hypotheses: , 2. Assumptions: The histogram shows approximate normality, sample is random. 3. Test statistic: 4. p-value: (very small) 5. Conclusion: There is strong evidence that the mean ESI in U.S. branches is less than 90. 6. 95% Confidence Interval: 7. Interpretation: The interval does not include 90, so the union representative should advocate for better working conditions in the U.S. branches.
