 Back
BackStatistical Inference: Sampling Distributions, Estimation, and Hypothesis Testing
Study Guide - Smart Notes
 Tailored notes based on your materials, expanded with key definitions, examples, and context.
Sampling Distributions
Sampling Distribution of the Sample Mean
The sampling distribution of the sample mean describes the distribution of sample means over repeated sampling from the same population. It is foundational for making inferences about population parameters.
Shape: If the population is normal, the sampling distribution of the mean is also normal. For large samples (n > 30), the Central Limit Theorem ensures approximate normality regardless of the population shape.
Mean: The mean of the sampling distribution is equal to the population mean, .
Standard Deviation (Standard Error): The standard deviation of the sampling distribution is , where is the population standard deviation and is the sample size.
Example: If upper leg length in 20-29 year old males is normal with mean 43.7 cm and standard deviation 4.2 cm, for a sample of 12 males:
Shape: Normal
Mean: 43.7 cm
Standard Error: cm
Sampling Distribution of Proportions
The sampling distribution of the sample proportion describes the distribution of sample proportions over repeated samples from the same population.
Shape: Approximately normal if and .
Mean: (population proportion)
Standard Deviation (Standard Error):
Example: If 15% of Americans have hearing trouble and a sample of 120 is taken:
Shape: Approximately normal
Mean: 0.15
Standard Error:
Estimation of Population Parameters
Point Estimation and Confidence Intervals for Means
Point estimation provides a single value as an estimate of a population parameter. Confidence intervals give a range of plausible values for the parameter.
Point Estimate: The sample mean is the best point estimate for the population mean .
Confidence Interval for Mean (when unknown):
is the critical value from the t-distribution with degrees of freedom.
is the sample standard deviation.
Margin of Error:
Example: A sample of 92 yields , . For a 95% confidence interval, find for and calculate the interval.
Properties of the t-Distribution
The t-distribution is symmetric and centered at 0.
It has heavier tails than the normal distribution, especially for small sample sizes.
As degrees of freedom increase, the t-distribution approaches the normal distribution.
Degrees of freedom:
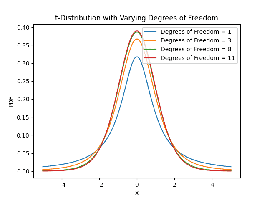
Additional info: The image above shows how the t-distribution changes with different degrees of freedom. As the sample size increases, the t-distribution becomes more similar to the standard normal distribution.
Confidence Intervals for Proportions
Point Estimate: (sample proportion)
Confidence Interval:
is the critical value from the standard normal distribution for the desired confidence level.
Hypothesis Testing
Hypothesis Testing for Means
Hypothesis testing is used to assess claims about population means.
Null Hypothesis (): The default assumption (e.g., ).
Alternative Hypothesis (): The claim to be tested (e.g., , , or ).
Test Statistic:
P-value: The probability of observing a test statistic as extreme as, or more extreme than, the observed value under .
Significance Level (): Common values are 0.01, 0.05, 0.10.
Decision Rule: If -value < , reject ; otherwise, fail to reject $H_0$.
Types of Errors
Type I Error: Rejecting when it is true (false positive). Probability = .
Type II Error: Failing to reject when is true (false negative). Probability = .
Hypothesis Testing for Proportions
Test Statistic:
P-value: Calculated based on the direction of the alternative hypothesis.
Two-Sample Inference
Two-Sample t-Test for Means
Used to compare the means of two independent groups.
Test Statistic:
Confidence Interval for Difference:
Two-Sample z-Test for Proportions
Used to compare the proportions of two independent groups.
Test Statistic:
is the pooled proportion:
Summary Table: Key Formulas
Parameter | Point Estimate | Standard Error | Confidence Interval |
|---|---|---|---|
Mean () | |||
Proportion () | |||
Difference of Means () | |||
Difference of Proportions () |
