 Back
BackStatistical Symbols and Calculator Output Interpretation (Chapters 1–3)
Study Guide - Smart Notes
 Tailored notes based on your materials, expanded with key definitions, examples, and context.
Statistical Symbols and Their Use in Descriptive Statistics
Population vs. Sample Notation
In statistics, it is essential to distinguish between data collected from a population and a sample. The symbols used for statistical measures differ depending on the source of the data, even though the calculation methods for some measures are similar.
Population Mean (\( \mu \)): Used when data represents the entire population.
Sample Mean (\( \overline{x} \)): Used when data is from a sample.
The formula for both means is the same:
The numerical value for the mean does not change based on the symbol, only the context does.
Standard Deviation: Sample vs. Population
The standard deviation measures the spread of data values. The formulas differ for a sample and a population, resulting in different numerical values:
Sample Standard Deviation (\( s \)): Used for sample data.
Population Standard Deviation (\( \sigma \)): Used for population data.
The formulas are:
Sample Standard Deviation:
Population Standard Deviation:
Because the denominators differ (\( n-1 \) for sample, \( N \) for population), the values of \( s \) and \( \sigma \) are generally not the same.
Common Statistical Symbols (Chapters 1–3)
The following table summarizes key symbols used in introductory statistics:
Symbol | Meaning |
|---|---|
f | Frequency |
\( \sum x \) | Summation of x-values |
n | Sample size |
N | Population size |
\( \overline{x} \) | Sample mean |
\( \mu \) | Population mean |
s | Sample standard deviation |
\( \sigma \) | Population standard deviation |
\( s^2 \) | Sample variance |
\( \sigma^2 \) | Population variance |
Q1 | First quartile |
Q2 | Median (second quartile) |
Q3 | Third quartile |
IQR | Interquartile range (\( Q_3 - Q_1 \)) |
Pk | kth percentile |
Interpreting TI-84 Calculator Output for 1-Variable Statistics
Understanding the TI-84 1-Var Stats Screen
The TI-84 calculator provides a summary of descriptive statistics for a single variable. The screen displays key values that correspond to the statistical symbols discussed above.
\( \overline{x} \): Sample mean
\( \sum x \): Sum of all data values
\( \sum x^2 \): Sum of the squares of all data values
Sx: Sample standard deviation (\( s \))
\( \sigma x \): Population standard deviation (\( \sigma \))
n: Number of data values (sample size)
minX: Minimum data value
Q1: First quartile
Example: The following TI-84 output summarizes a data set of 18 values:
Sample mean (\( \overline{x} \)): 33.22
Sum of values (\( \sum x \)): 598
Sample standard deviation (Sx): 15.94
Population standard deviation (\( \sigma x \)): 15.49
Sample size (n): 18
Minimum value: 12
First quartile (Q1): 19
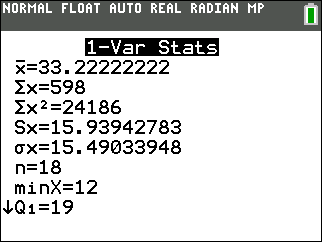
This output helps you quickly identify key descriptive statistics for further analysis or reporting.
Additional info: The TI-84 calculator is widely used in introductory statistics courses for computing and interpreting basic descriptive statistics. Understanding the correspondence between calculator output and statistical notation is essential for accurate reporting and interpretation.
