 Back
BackStatistics Final Exam Study Notes: Probability, Random Variables, and Regression
Study Guide - Smart Notes
 Tailored notes based on your materials, expanded with key definitions, examples, and context.
Probability Rules and Concepts
Basic Probability Rules
Probability is the mathematical study of randomness and uncertainty. The following rules are fundamental for calculating probabilities in various scenarios:
Total Probability Rule: The probability of the sample space S is always 1.
Complement Rule: The probability of an event A is 1 minus the probability of its complement.
Addition Rule for Disjoint Events: If A and B are mutually exclusive,
General Addition Rule: For any two events,
Conditional Probability: The probability of B given A is
General Multiplication Rule:
Multiplication Rule for Independent Events: If A and B are independent,
Random Variables and Their Properties
Expected Value and Variance
A random variable is a numerical outcome of a random process. The expected value (mean), variance, and standard deviation are key characteristics:
Expected Value (Mean):
Variance:
Standard Deviation:
Combining Random Variables
Adding/Subtracting Constants: Adding a constant to a random variable shifts the mean but does not affect the variance or standard deviation.
Multiplying by Constants: Multiplying a random variable by a constant a multiplies the mean by a and the standard deviation by |a|:
If X and Y are independent:
Binomial Model
Binomial Probability
The binomial model describes the probability of k successes in n independent trials, each with probability p of success:
Binomial Coefficient:
Probability of k successes: , where
Mean (Expected Number of Successes):
Standard Deviation:
n = number of trials, k = number of successes, p = probability of success, q = probability of failure.
Correlation and Regression
Correlation Coefficient
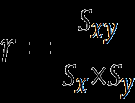
The correlation coefficient (r) measures the strength and direction of a linear relationship between two quantitative variables:
Formula:
Where is the covariance, and are the standard deviations of X and Y, respectively.
Regression Analysis
Regression is used to model the relationship between a dependent variable Y and an independent variable X.
Residual:
Line of Best Fit:
Slope:
Intercept:
Regression to the Mean: The predicted value is closer to the mean of Y than X is to the mean of X, unless r = ±1.
Residual Standard Deviation: Measures the typical size of the residuals (errors) from the regression line.
The Normal Model and Z-Scores
Standard Deviation as a Ruler and the Normal Model
The normal model is a symmetric, bell-shaped distribution characterized by its mean (μ) and standard deviation (σ). Z-scores standardize values for comparison:
Z-Score:
Z-scores indicate how many standard deviations a value is from the mean.
Normal tables (Z-tables) are used to find probabilities and percentiles for standard normal distributions.
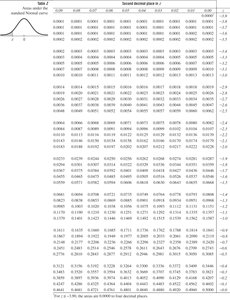
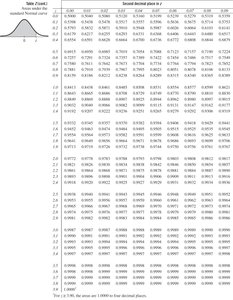
Using the Standard Normal Table
The standard normal table provides the area (probability) to the left of a given z-score in the standard normal distribution. To use the table:
Find the row for the first two digits of the z-score.
Find the column for the second decimal place.
The intersection gives the cumulative probability.
For negative z-scores, use the left table; for positive z-scores, use the right table.
Summary Table: Key Formulas and Concepts
Concept | Formula | Description |
|---|---|---|
Expected Value | Mean of a random variable | |
Variance | Spread of a random variable | |
Standard Deviation | Typical deviation from the mean | |
Binomial Probability | Probability of k successes in n trials | |
Correlation Coefficient | Strength of linear relationship | |
Regression Line | Best fit line for prediction | |
Z-Score | Standardized value |
