 Back
BackStatistics Fundamentals: Data Types, Sampling, Bias, and Data Visualization
Study Guide - Smart Notes
 Tailored notes based on your materials, expanded with key definitions, examples, and context.
Q1. Classify the following data by type and scale of measurement.
Background
Topic: Data Types and Measurement Scales
This question tests your understanding of how to classify data as qualitative (categorical) or quantitative (numerical), and to identify the appropriate scale of measurement (nominal, ordinal, interval, ratio, discrete, continuous, etc.).
Key Terms and Concepts:
Qualitative (Categorical) Data: Describes qualities or categories (e.g., eye color, marital status).
Quantitative (Numerical) Data: Represents measurable quantities (e.g., height, hourly pay).
Nominal Scale: Categories with no inherent order (e.g., eye color).
Ordinal Scale: Categories with a meaningful order but no consistent difference between ranks (e.g., education level).
Interval Scale: Ordered, equal intervals, but no true zero (e.g., temperature in Celsius).
Ratio Scale: Ordered, equal intervals, and a true zero (e.g., height, hourly pay).
Discrete Data: Countable values (e.g., number of employees).
Continuous Data: Any value within a range (e.g., height).
Step-by-Step Guidance
For each item (a–g), decide if the data is qualitative or quantitative.
Determine if the data is discrete or continuous (for quantitative data).
Identify the scale of measurement (nominal, ordinal, interval, or ratio).
Think about whether the data can be ordered, counted, or measured.
Try solving on your own before revealing the answer!
Q2. Sampling and Sample Statistic
Background
Topic: Sampling, Populations, and Sample Statistics
This question examines your understanding of populations, sampling frames, and how to calculate a sample statistic (such as a proportion). It also asks you to consider ways to improve detection rates in a study.
Key Terms and Formulas:
Population: The entire group you want to study.
Sampling Frame: The list or database from which the sample is drawn.
Sample Statistic: A numerical summary calculated from the sample (e.g., sample proportion).
Sample Proportion Formula:
Step-by-Step Guidance
Identify the population (all entities you want to generalize to) and the sampling frame (the actual list used for sampling).
Calculate the sample statistic using the formula for sample proportion.
Consider what factors might increase the detection rate (e.g., sample size, audit methods).
Try solving on your own before revealing the answer!
Q3. Sampling Bias vs. Non-Sampling Bias
Background
Topic: Types of Bias in Data Collection
This question tests your ability to distinguish between sampling bias (errors due to the way the sample is selected) and non-sampling bias (errors not related to the sampling process, such as measurement or response errors).
Key Terms:
Sampling Bias: Systematic error due to non-random sampling.
Non-Sampling Bias: Errors from data collection, recording, or respondent behavior.
Step-by-Step Guidance
For each scenario (a–d), decide if the error is due to the sampling process or something else.
Recall that sampling bias affects who is included in the sample, while non-sampling bias affects the data collected from the sample.
Try solving on your own before revealing the answer!
Q4. Differences Between Sampling Methods
Background
Topic: Sampling Methods
This question asks you to compare three common probability sampling methods: Simple Random Sampling (SRS), Stratified Random Sampling, and Cluster Sampling.
Key Terms:
Simple Random Sampling (SRS): Every member has an equal chance of being selected.
Stratified Random Sampling: Population divided into subgroups (strata), and random samples taken from each stratum.
Cluster Sampling: Population divided into clusters, some clusters are randomly selected, and all or some members within chosen clusters are sampled.
Step-by-Step Guidance
Define each sampling method clearly.
List the main differences in how samples are selected and when each method is appropriate.
Think about the advantages and disadvantages of each method.
Try solving on your own before revealing the answer!
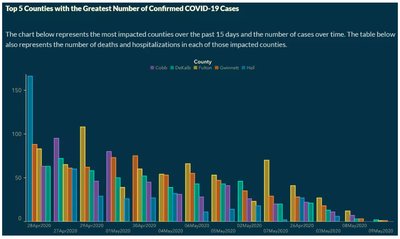
Q5. Critique of a COVID-19 Data Plot
Background
Topic: Data Visualization and Interpretation
This question asks you to critically evaluate a bar chart showing COVID-19 cases in different counties over time. You are expected to identify any issues with the way the data is presented.
Key Concepts:
Data Visualization: The graphical representation of data to communicate information clearly.
Misleading Graphs: Graphs can be misleading due to poor labeling, inconsistent scales, or unclear grouping.
Step-by-Step Guidance
Examine the axes and labels: Are the dates and counties clearly labeled and easy to interpret?
Check if the grouping of data (e.g., by county or by date) is consistent and logical.
Look for any visual elements that could confuse the viewer (e.g., color coding, legend, overlapping bars).
Consider if the chart accurately represents the trends or if it could be misinterpreted.
Try solving on your own before revealing the answer!
Q6. Sampling Method and Potential Issues
Background
Topic: Systematic Sampling and Potential Bias
This question asks you to identify the sampling method used (selecting every 3rd employee from an ordered list) and to consider any problems with this approach.
Key Terms:
Systematic Sampling: Selecting every k-th item from a list after a random start.
Sampling Bias: Can occur if the list order is related to the variable of interest.
Step-by-Step Guidance
Identify the sampling method based on the description (every 3rd employee from an ordered list).
Consider how the ordering of the list (from largest to smallest days off) might affect the representativeness of the sample.
Think about what kind of bias could be introduced by this method.
Try solving on your own before revealing the answer!
