 Back
BackLesson 1
Study Guide - Smart Notes
 Tailored notes based on your materials, expanded with key definitions, examples, and context.
Statistics: The Art and Science of Learning From Data
Introduction to Statistics
Statistics is a discipline that enables us to learn from data by designing studies, analyzing data, and making informed decisions. It is foundational to understanding how to draw meaningful conclusions from numerical information.
Definition: Statistics is the art and science of collecting, analyzing, and interpreting data.
Applications: Used in fields such as medicine, marketing, social sciences, and sports.
Key Question: How can statistics help you learn about the world? By examining data, we can answer questions and make predictions.
Data: The Foundation of Statistics
Data is the information gathered through experiments and surveys. It forms the basis for statistical analysis.
Types of Data Collection:
Surveys (e.g., effectiveness of a TV ad measured by the percentage of people who went to Starbucks)
Experiments (e.g., measuring subjects before and after a low carbohydrate diet)
Example: Survey on TV ad effectiveness: Data could be the percentage of people who visited Starbucks after the ad aired.
Example: Experiment on low carbohydrate diet: Data could be measurements on subjects before and after the experiment.


Probability vs. Statistics
Probability and statistics are related but distinct fields. Probability deals with predicting outcomes given known parameters, while statistics infers parameters from observed data.
Probability: Given population information, calculate the likelihood of outcomes in a sample.
Statistics: Given sample data, infer information about the population.
Example: If the political affiliations of a population are known, probability can predict the composition of a sample. If only sample data is available, statistics is used to estimate population parameters.
Three Aspects of Statistical Studies
Statistical studies involve three main aspects: design, description, and inference.
Design: Planning how to obtain data (e.g., sampling methods, experimental setup).
Description: Summarizing data using graphs and numerical summaries.
Inference: Making decisions and predictions about populations based on sample data.
Descriptive Statistics
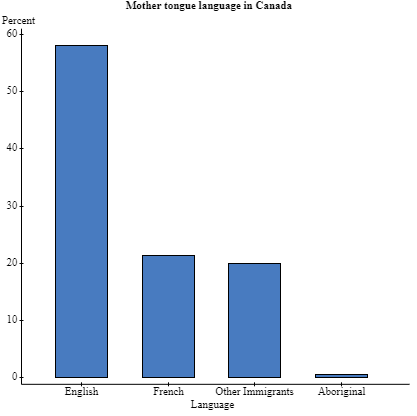
Descriptive statistics summarize raw data and present it in a useful format, such as averages, charts, or graphs.
Methods: Graphs (bar charts, line graphs), numerical summaries (mean, median, mode).
Example: A meteorologist constructs a line graph showing monthly precipitation.
Example: The average age of students in a statistics class is 25 years.
Design Statistics
Design statistics focus on planning data collection to ensure trustworthy results.
Examples:
Planning methods for studying the effects of Vitamin E on athletic strength.
Selecting people for a marketing survey to provide proper coverage.
Purpose: To ensure results are reliable and representative.
Inferential Statistics
Inferential statistics involve making decisions or predictions about a population based on sample data.
Methods: Estimation (confidence intervals), hypothesis testing.
Example: Predicting the proportion of drivers violating a law based on sample data.
Example: Calculating a confidence interval for the proportion of voters approving of a political leader.
Populations and Samples
Understanding the difference between populations and samples is fundamental in statistics.
Population: All subjects of interest in a study.
Sample: A subset of the population for whom data is collected.
Example: In a survey of 29,516 Canadians about police fairness, the population is all Canadians, and the sample is the 29,516 respondents.

Subjects in Statistical Studies
Subjects are the entities measured in a study. They can be individuals, groups, animals, or objects.
Examples: Individuals, schools, rats, rural municipalities, widgets.


Descriptive vs. Inferential Statistics
Descriptive statistics summarize data, while inferential statistics use sample data to make predictions about populations.
Descriptive Statistics: Graphs, averages, percentages.
Inferential Statistics: Confidence intervals, hypothesis tests.
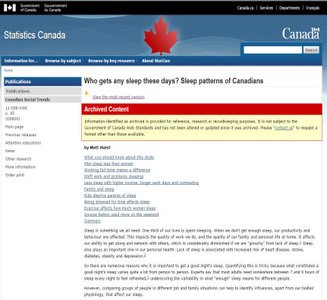
Example: Calculating the average sleep duration from survey data (descriptive); predicting the average sleep duration for all Canadians (inferential).
Sample Statistics and Population Parameters
Statistics and parameters are numerical summaries of samples and populations, respectively.
Parameter: Numerical summary of the population (e.g., mean µ, proportion p).
Statistic: Numerical summary of a sample (e.g., sample mean, sample proportion).
Example: Mean number of cigarettes smoked by all teenagers (parameter); mean number smoked by a sample of teenagers (statistic).
Randomness in Sampling
Randomness is essential for ensuring that samples are representative of populations.
Simple Random Sampling (SRS): Each subject has an equal chance of being selected.
Importance: Randomness allows for powerful inferences and reduces bias.
Variability in Statistics
Variability refers to differences in measurements between subjects and samples.
Sources: Individual differences, sample differences.
Impact: Larger samples generally yield more accurate predictions.
Randomness and Variability: Example
Statistical concepts can be illustrated using sports, such as basketball. Runs of consecutive successes (e.g., made shots) can be analyzed using random sampling and probability.
Example: Analyzing the likelihood of a basketball player making five shots in a row compared to a coin landing heads five times in a row.
Application: Use random numbers to simulate outcomes and estimate probabilities.

Lesson Summary
Statistics is the art and science of learning from data.
The statistical process relies on proper design (how to obtain data from a population for a sample).
There are two types of statistical analysis:
Descriptive statistics: Numerical and graphical summary of sample data.
Inferential statistics: Use sample statistics to make predictions about population parameters.
Random sampling is crucial for representativeness.
Variability is inherent in statistics; results depend on the sample chosen.
