Back

Statistics Review: Five Number Summary, Boxplots, Empirical Rule, Z-scores, Regression, and More

Study Guide - Learn with Videos

Curated lessons matched to your uploaded material – learn every topic step by step.

Boxplots

  • Guided course
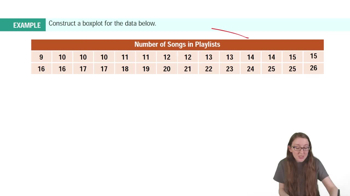
    Boxplots Example 1
    01:52
  • Guided course
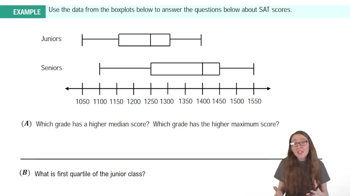
    Boxplots Example 2
    02:48
  • Guided course
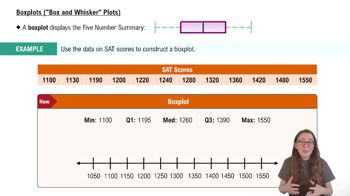
    Boxplots ("Box and Whisker Plots")
    03:54

Interpreting Standard Deviation

  • Guided course
    Empirical Rule of Standard Deviation and Range Rule of Thumb Example 1
    05:42
  • Guided course
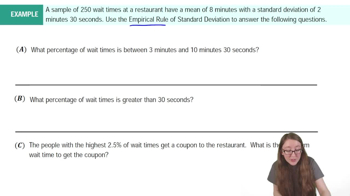
    Empirical Rule of Standard Deviation and Range Rule of Thumb Example 2
    01:56
  • Guided course
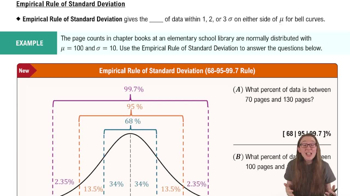
    Empirical Rule of Standard Deviation and Range Rule of Thumb
    07:10

Standard Deviation

  • Guided course
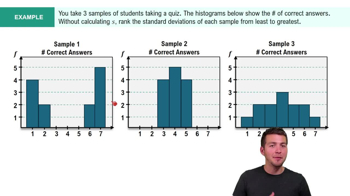
    Calculating Standard Deviation
    08:45
  • Guided course
    Calculating Standard Deviation Example 1
    02:59

Histograms

  • Guided course
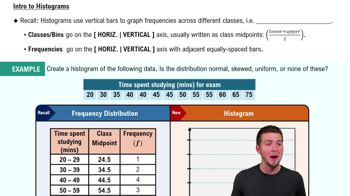
    Intro to Histograms
    05:54
  • Guided course
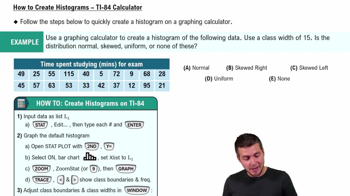
    How to Create Histogram - TI-84 Calculator
    07:10

Pie Charts

  • Guided course
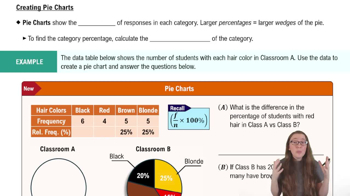
    Creating Pie Charts
    06:10
  • Guided course
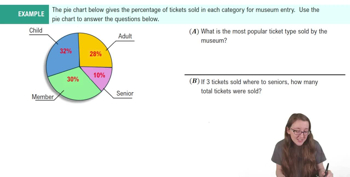
    Pie Charts Example 1
    01:18

Bar Graphs and Pareto Charts

  • Guided course
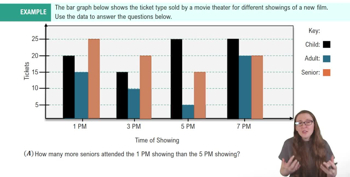
    Bar Graphs and Pareto Charts Example 1
    05:26
  • Guided course
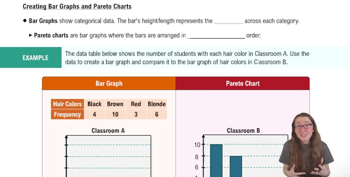
    Creating Bar Graphs and Pareto Charts
    04:52

Standard Normal Distribution

  • Guided course
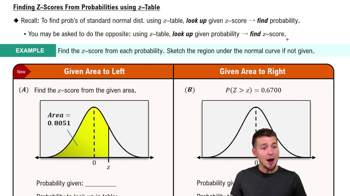
    Z-Scores from Probabilities
    08:50
  • Guided course
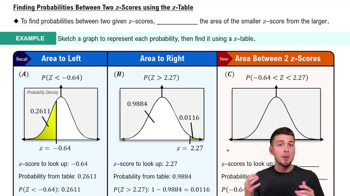
    Probabilities Between Two Values
    03:50
  • Guided course
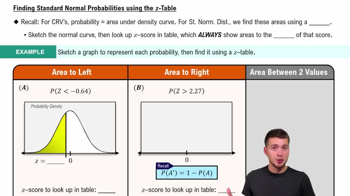
    Finding Standard Normal Probabilities using z-Table
    09:47

Probabilities & Z-Scores w/ Graphing Calculator

  • Guided course
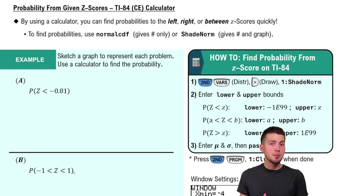
    Probability From Given Z-Scores - TI-84 (CE) Calculator
    07:09
  • Guided course
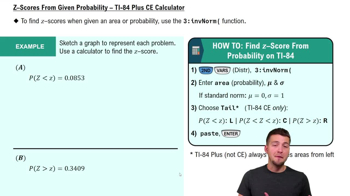
    Z-Scores From Given Probability - TI-84 (CE) Calculator
    06:31

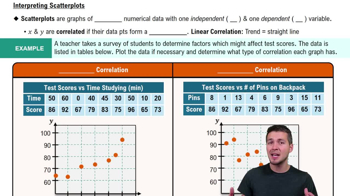
Scatterplots & Intro to Correlation

  • Guided course
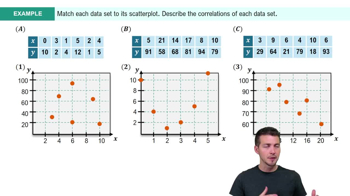
    Scatterplots & Intro to Correlation Example 1
    05:14
  • Guided course
    Scatterplots & Intro to Correlation
    06:36
  • Guided course
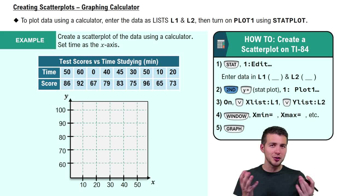
    Creating Scatterplots - Graphing Calculator
    05:26

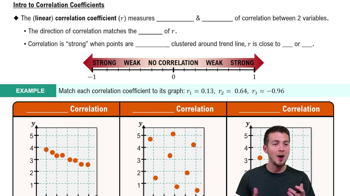
Correlation Coefficient

  • Guided course
    Correlation Coefficient
    05:43
  • Guided course
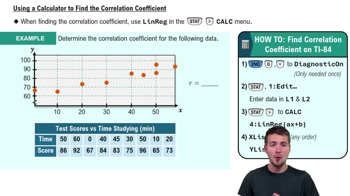
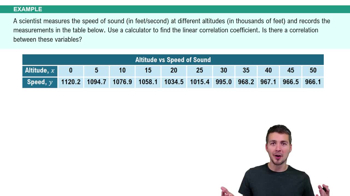
    Calculating Correlation Coefficient - Graphing Calculator
    04:40
  • Guided course
    Calculating Correlation Coefficient - Graphing Calculator Example 1
    03:44

Linear Regression & Least Squares Method

  • Guided course
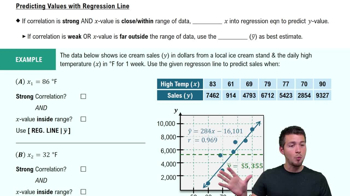
    Using Regression Lines to Predict Values
    04:57
  • Guided course
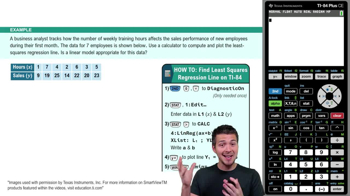
    Intro to Least Squares Regression Example 1
    05:02
  • Guided course
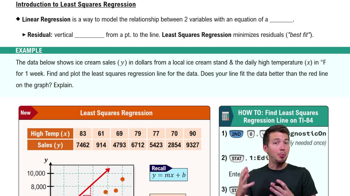
    Intro to Least Squares Regression
    07:01

Residuals

  • Guided course
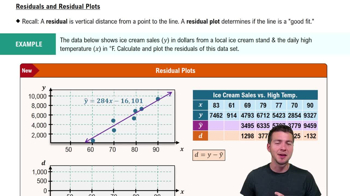
    Residuals and Residual Plots
    07:38

Coefficient of Determination

  • Guided course
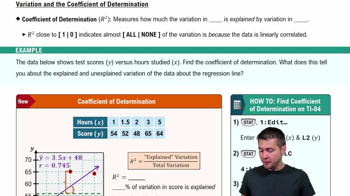
    Coefficient of Determination
    06:14