Back
BackStatistics Review: Week 1 Study Guidance
Study Guide - Smart Notes
 Tailored notes based on your materials, expanded with key definitions, examples, and context.
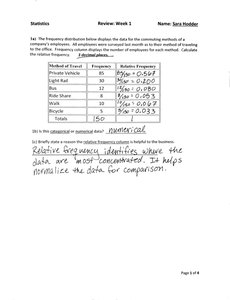
Q1. Calculate the relative frequency for each commuting method.
Background
Topic: Frequency Distributions & Relative Frequency
This question tests your understanding of how to convert raw frequencies into relative frequencies, which are useful for comparing proportions across categories.
Key Terms and Formulas:
Frequency: The count of occurrences for each category.
Relative Frequency: The proportion of the total represented by each category.
Key formula:
Step-by-Step Guidance
Identify the frequency for each commuting method from the table.
Find the total frequency (sum of all frequencies).
For each method, divide its frequency by the total frequency to get the relative frequency.
Write the relative frequency as a decimal rounded to three places.
Try solving on your own before revealing the answer!
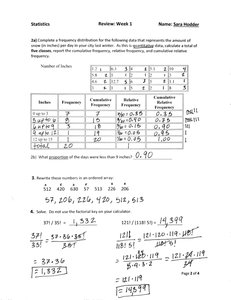
Q2. Complete a frequency distribution for the number of inches of snow in your city last winter.
Background
Topic: Frequency Distribution Tables, Cumulative Frequency, Relative Frequency
This question tests your ability to organize data into a frequency table, calculate cumulative and relative frequencies, and interpret the results.
Key Terms and Formulas:
Frequency: Number of times a value occurs.
Cumulative Frequency: Running total of frequencies up to a certain value.
Relative Frequency: Proportion of each frequency to the total.
Key formulas:
Step-by-Step Guidance
List the number of inches and their corresponding frequencies.
Calculate the cumulative frequency for each row by adding the current frequency to the previous cumulative total.
Compute the relative frequency for each row using the formula above.
Check that the sum of all relative frequencies is close to 1.
Try solving on your own before revealing the answer!
Q3. Complete a stem-and-leaf diagram for the number of statistics textbooks ordered by 10 college bookstores.
Background
Topic: Data Visualization – Stem-and-Leaf Plots
This question tests your ability to organize numerical data into a stem-and-leaf plot, which helps visualize the distribution and identify patterns.
Key Terms and Formulas:
Stem: The leading digit(s) of each number.
Leaf: The trailing digit(s) of each number.
Step-by-Step Guidance
Sort the data values in ascending order.
Identify the stem (usually the tens place) and the leaf (usually the ones place) for each value.
Group the leaves by their corresponding stems.
Draw the stem-and-leaf plot, listing stems in a column and leaves beside them.
Try solving on your own before revealing the answer!
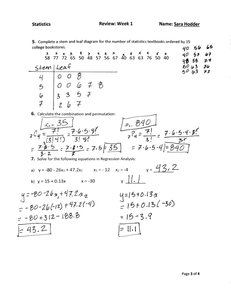
Q4. Calculate the combination and permutation for a given set.
Background
Topic: Counting Principles – Combinations and Permutations
This question tests your understanding of how to calculate the number of ways to arrange or select items from a set, using combinations and permutations.
Key Terms and Formulas:
Permutation: Arrangement of items where order matters.
Combination: Selection of items where order does not matter.
Key formulas:
Step-by-Step Guidance
Identify the values of (total items) and (items to select or arrange).
For permutations, use the formula and substitute the values.
For combinations, use the formula and substitute the values.
Calculate the factorials as needed, but stop before the final computation.
Try solving on your own before revealing the answer!
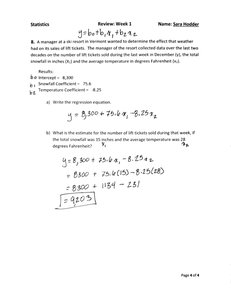
Q5. Write the regression equation and use it to estimate the number of ski tickets sold.
Background
Topic: Regression Analysis
This question tests your ability to write a regression equation and use it to make predictions based on given coefficients and values.
Key Terms and Formulas:
Regression Equation: An equation that models the relationship between variables.
Intercept: The value of the dependent variable when all independent variables are zero.
Coefficients: Numbers that multiply each independent variable in the equation.
Key formula:
Step-by-Step Guidance
Write the regression equation using the provided intercept and coefficients.
Identify the values for and (e.g., snowfall and temperature).
Substitute the values into the regression equation.
Calculate each term separately, but stop before adding them for the final prediction.
Try solving on your own before revealing the answer!