 Back
BackStatistics Test #2 Review: Correlation, Regression, and Probability
Study Guide - Smart Notes
 Tailored notes based on your materials, expanded with key definitions, examples, and context.
Q1. Does a linear correlation between CO2 concentration and global mean temperature imply causation?
Background
Topic: Correlation vs. Causation
This question tests your understanding of the difference between correlation and causation in statistics, especially in the context of interpreting real-world data relationships.
Key Terms:
Correlation: A statistical measure that describes the extent to which two variables change together.
Causation: When one variable directly affects another.
Step-by-Step Guidance
Recall that a linear correlation (such as Pearson's r) measures the strength and direction of a linear relationship between two variables, but does not indicate a cause-and-effect relationship.
Think about other factors that could influence both variables (confounding variables), or whether the observed relationship could be coincidental.
Consider what additional evidence or study design would be needed to establish causation (e.g., controlled experiments, ruling out confounders).
Try solving on your own before revealing the answer!
Q2. Cheese and Engineering: Is there a linear correlation between cheese consumption and civil engineering PhDs? Does this suggest causation?
Background
Topic: Correlation, Spurious Correlation, and Causation
This question asks you to analyze a data set for correlation and to interpret whether a relationship implies causation or could be spurious.
Key Terms and Formulas:
Linear Correlation Coefficient (r): Measures the strength and direction of a linear relationship between two variables.
Spurious Correlation: When two variables appear to be related but are actually both influenced by a third variable or coincidence.
Step-by-Step Guidance
Examine the data for a pattern: as cheese consumption increases, does the number of PhDs also increase?
Calculate the correlation coefficient (r) using the formula or technology (StatCrunch, calculator, etc.).
Interpret the value of r: Is it close to 1 or -1 (strong correlation), or near 0 (weak/no correlation)?
Think critically: Even if a strong correlation exists, consider whether it makes logical sense for cheese consumption to cause PhDs, or if this is likely a spurious correlation.
Try solving on your own before revealing the answer!
Q3. Regression Equation Interpretation
Background
Topic: Simple Linear Regression
This question tests your ability to interpret the components of a regression equation and understand the meaning of slope, intercept, and predictor/response variables.
Key Terms and Formulas:
Regression Equation:
Slope (b1): The change in the predicted value of y for a one-unit increase in x.
Intercept (b0): The predicted value of y when x = 0.
Step-by-Step Guidance
Identify what the variable x represents in the context of the problem (e.g., car weight).
State the values of the slope and intercept from the given regression equation.
Determine which variable is the predictor (independent) and which is the response (dependent).
Set up the calculation for the predicted value of y when x = 3000, but do not compute the final value yet.
Try solving on your own before revealing the answer!
Q4. Regression Prediction for Small Cars
Background
Topic: Regression Prediction
This question asks you to use a regression equation to predict a value for a given x, using summary statistics and the regression line.
Key Terms and Formulas:
Regression Equation:
Prediction: Substitute the given x-value into the regression equation to estimate y.
Step-by-Step Guidance
Identify the regression equation and the value of x for which you are making a prediction (e.g., x = 2500 lb).
Substitute the value of x into the regression equation.
Simplify the expression to set up for the final calculation, but do not compute the final value yet.
Try solving on your own before revealing the answer!
Q5. Bear Measurements: Predicting Weight from Head Width
Background
Topic: Regression Prediction
This question involves using a regression equation to predict the weight of a bear based on its head width.
Key Terms and Formulas:
Regression Equation:
Prediction: Substitute the given head width into the regression equation to estimate weight.
Step-by-Step Guidance
Identify the regression equation and the value of x (head width) for which you are making a prediction (e.g., x = 6.5 in).
Substitute the value of x into the regression equation.
Simplify the expression to set up for the final calculation, but do not compute the final value yet.
Try solving on your own before revealing the answer!
Q6. Probability: ESP Experiment
Background
Topic: Basic Probability
This question tests your understanding of probability as a measure of the likelihood of a single event occurring.
Key Terms and Formulas:
Probability:
Step-by-Step Guidance
Identify the probability of answering a question correctly (given as 20%).
Express this probability as a decimal or fraction as appropriate.
Try solving on your own before revealing the answer!
Q7. Probability: Multiple Choice Test
Background
Topic: Probability of Complementary Events
This question asks you to find the probability of a wrong answer when guessing on a multiple-choice question.
Key Terms and Formulas:
Probability of a Wrong Answer:
Step-by-Step Guidance
Determine the probability of guessing correctly (e.g., 1 out of 5 choices).
Subtract this probability from 1 to find the probability of a wrong answer.
Try solving on your own before revealing the answer!
Q8. Probability: Birthday Problem
Background
Topic: Probability of a Specific Outcome
This question asks you to calculate the probability that a randomly selected day is the author's birthday.
Key Terms and Formulas:
Probability: (for a non-leap year)
Step-by-Step Guidance
Recognize that there are 365 possible days in a year (ignoring leap years).
Set up the probability as the ratio of 1 favorable outcome to 365 possible outcomes.
Try solving on your own before revealing the answer!
Q9. Probability: Online Courses
Background
Topic: Probability of Independent Events
This question asks you to find the probability that two randomly selected students both take online courses only, given the probability for one student.
Key Terms and Formulas:
Probability of Independent Events:
Step-by-Step Guidance
Identify the probability that one student takes online courses only (given as 10%).
Multiply this probability by itself to find the probability that both students take online courses only.
Try solving on your own before revealing the answer!
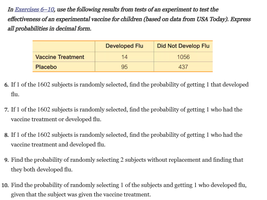
Q10. Probability with Experimental Data (Vaccine Study)
Background
Topic: Probability from Contingency Tables
This question asks you to calculate probabilities based on experimental results presented in a two-way table.
Key Terms and Formulas:
Probability:
Step-by-Step Guidance
Identify the relevant counts from the table for each scenario (e.g., developed flu, vaccine group, etc.).
Set up the probability as a fraction using the appropriate counts and the total number of subjects.
For questions involving "without replacement," adjust the denominator for the second selection.
Try solving on your own before revealing the answer!
Q11. Probability with Left-Handedness Data
Background
Topic: Probability with Categorical Data
This question involves calculating probabilities from a contingency table, including joint and marginal probabilities, and interpreting results.
Key Terms and Formulas:
Marginal Probability: Probability of a single event occurring.
Joint Probability: Probability of two events occurring together.
Step-by-Step Guidance
Identify the relevant counts for each scenario (e.g., female, left-handed, both, etc.).
Set up the probability as a fraction using the appropriate counts and the total number of subjects.
For questions involving "without replacement," adjust the denominator for the second selection.
Try solving on your own before revealing the answer!
Q12. Bear Weight and Chest Size: Correlation and Prediction
Background
Topic: Correlation and Regression Analysis
This question asks you to interpret correlation results and consider the practical implications of using one variable to predict another.
Key Terms and Formulas:
Correlation Coefficient (r): Measures the strength and direction of a linear relationship.
P-value: Used to test the statistical significance of the correlation.
Step-by-Step Guidance
Interpret the value of the correlation coefficient (r) and compare it to the critical value to determine significance.
Consider whether the relationship is strong enough to use chest size as a predictor for weight.
Think about the practical implications: Is chest size easier to measure than weight? Would this be useful in practice?
Try solving on your own before revealing the answer!
Q13. Word Counts and Heights: Correlation Analysis
Background
Topic: Linear Regression and Correlation
This question asks you to interpret regression output and correlation results to determine if a significant relationship exists between two variables.
Key Terms and Formulas:
Simple Linear Regression:
Correlation Coefficient (r): Indicates the strength and direction of the relationship.
P-value: Used to assess statistical significance.
Step-by-Step Guidance
Review the regression output for the coefficient, r, and p-value.
Compare the p-value to the significance level (e.g., 0.05) to determine if the relationship is statistically significant.
Interpret the practical meaning of the results in the context of the variables (e.g., word counts, heights).
Try solving on your own before revealing the answer!
Q14. Calculating Pearson's r
Background
Topic: Pearson Correlation Coefficient Calculation
This question asks you to use the formula for Pearson's r to calculate the linear correlation coefficient from raw data.
Key Formula:
Step-by-Step Guidance
List all the x and y values from your data set.
Calculate the sums: , , , , and .
Plug these sums into the formula for r, but do not compute the final value yet.
Try solving on your own before revealing the answer!
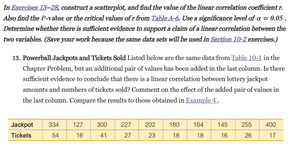
Q15. Powerball Jackpots and Tickets Sold: Correlation Analysis
Background
Topic: Correlation and Statistical Significance
This question asks you to calculate the correlation coefficient for two variables and determine if the correlation is statistically significant.
Key Terms and Formulas:
Correlation Coefficient (r): Use the Pearson formula as above.
Critical Value: Compare your calculated r to the critical value for your sample size and significance level.
Step-by-Step Guidance
List the jackpot and ticket values as x and y.
Calculate the necessary sums for the Pearson formula.
Compute r and compare it to the critical value to determine significance, but do not state the final result yet.
Try solving on your own before revealing the answer!
