 Back
BackStatistics Unit 1: Data Collection, Summarization, and Numerical Description
Study Guide - Smart Notes
 Tailored notes based on your materials, expanded with key definitions, examples, and context.
Statistics Unit 1: Data Collection, Summarization, and Numerical Description
Vocabulary and Fundamental Concepts
This section introduces foundational terminology and distinctions essential for understanding statistics. Mastery of these terms is crucial for interpreting data and conducting statistical analyses.
Population vs. Sample: A population is the entire group of individuals or items of interest, while a sample is a subset selected from the population for analysis.
Parameter vs. Statistic: A parameter is a numerical summary of a population; a statistic summarizes a sample.
Descriptive vs. Inferential Statistics: Descriptive statistics summarize and describe data; inferential statistics draw conclusions about populations based on samples.
Variables vs. Data: Variables are characteristics measured; data are the observed values.
Quantitative vs. Qualitative Variables/Data: Quantitative variables are numerical (discrete or continuous); qualitative/categorical variables describe categories or qualities.
Types of Studies and Experimental Design
Understanding study design is essential for evaluating the validity of statistical conclusions.
Explanatory and Response Variables: The explanatory variable (independent) may influence the response variable (dependent).
Observational Study vs. Designed Experiment: Observational studies (cross-sectional, case-control, cohort/prospective) observe without intervention; designed experiments (completely randomized, matched-pairs) involve controlled manipulation.
Confounding vs. Lurking Variables: Confounding variables affect both explanatory and response variables; lurking variables are unmeasured but influence results.
Sampling Schemes: Includes simple random, stratified, cluster, convenience, multistage, and self-selected/voluntary response.
Sources of Bias: Sampling bias, nonresponse bias, response bias, and undercoverage can distort results.
Open vs. Closed Questions: Open questions allow free response; closed questions provide fixed choices.
Sampling vs. Non-sampling Errors: Sampling errors arise from sample selection; non-sampling errors from data collection or processing.
Experiment Terminology
Key terms for understanding experimental design and analysis.
Experimental Unit/Subject: The individual or item receiving a treatment.
Factor: The variable manipulated in an experiment.
Treatment: The specific condition applied to experimental units.
Placebo Effect: Improvement due to expectation, not treatment.
Blinding: Concealing treatment assignment to reduce bias.
Replication: Repeating experiments to ensure reliability.
Organizing and Summarizing Data
Raw Data and Frequency Distributions
Raw data are unprocessed observations. Frequency distributions organize data into classes or categories, showing how often each occurs.
Classes: Groupings of data values.
Class Width: Difference between lower limits of consecutive classes.
Class Limits: Lower and upper bounds for each class.
Class Midpoints: Average of lower and upper class limits.
Frequency: Number of observations in a class.
Relative Frequency: Proportion of observations in a class.
Cumulative Frequency: Total number of observations up to a class.
Graphical Representation of Data
Visualizing data helps reveal patterns and distributions.
Qualitative Data Graphs: Bar graph/Pareto chart, side-by-side bar graph, pie chart.
Quantitative Data Graphs: Histogram, dot plot, stem-and-leaf plot, time-series graph, boxplot.
Distribution Shapes: Symmetric, uniform, bell-shaped, skewed left, skewed right.
Using StatCrunch for Frequency Distributions and Graphs
StatCrunch provides tools for constructing frequency tables and graphs for both qualitative and quantitative data.
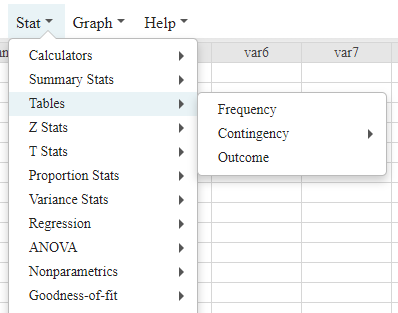
For qualitative data: Use Stat > Tables > Frequency for frequency distributions, Graph > Bar Plot for bar graphs, and Graph > Pie Chart for pie charts.
For quantitative data: Use Stat > Tables > Frequency with binning options, Graph > Histogram for histograms, Graph > Dotplot for dot plots, Graph > Stem and Leaf for stem-and-leaf plots, Graph > Scatterplot for time-series graphs, and Graph > Boxplot for boxplots.
Numerically Summarizing Data
Measures of Center
Measures of center describe the typical value in a data set.
Mean (Arithmetic Mean): The average value. For a sample: ; for a population: .
Weighted Mean:
Grouped Data Mean: For a sample: ; for a population:
Median: The middle value when data are ordered. If is odd, median is the th value; if is even, median is the mean of the th and th values.
Mode: The most frequently occurring value.
Measures of Dispersion
Measures of dispersion describe the spread or variability in a data set.
Range:
Variance and Standard Deviation (Ungrouped Data):
Sample variance:
Sample standard deviation:
Population variance:
Population standard deviation:
Variance and Standard Deviation (Grouped Data):
Sample variance:
Sample standard deviation:
The Empirical Rule
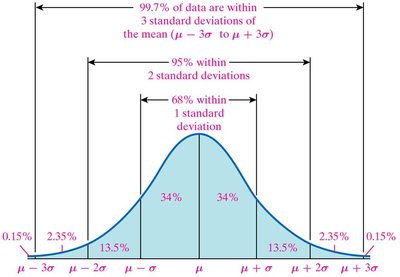
The Empirical Rule applies to bell-shaped (normal) distributions, providing approximate percentages of data within certain standard deviations from the mean.
Approximately 68% of data lie within one standard deviation ().
Approximately 95% of data lie within two standard deviations ().
Approximately 99.7% of data lie within three standard deviations ().
Measures of Position and Outliers
Measures of position help identify where a value stands relative to the rest of the data, and methods for detecting outliers are essential for data integrity.
z-score: Indicates how many standard deviations a value is from the mean.
Sample:
Population:
Percentiles: The kth percentile () is the value below which k% of observations fall.
Quartiles: Divide data into four equal parts. is the median of the lower half, is the overall median, is the median of the upper half.
Five-Number Summary: Consists of minimum, , median, , and maximum.
Interquartile Range (IQR):
Checking for Outliers:
Lower fence:
Upper fence:
Values outside these fences are considered outliers.
Describing Distributions
To describe a distribution, specify its shape (skewed left, skewed right, symmetric), center (mean or median), and spread (standard deviation or interquartile range).
Term | Definition | Example |
|---|---|---|
Mean | Average value | Mean income of a sample |
Median | Middle value | Median age in a population |
Mode | Most frequent value | Most common shoe size |
Range | Difference between largest and smallest | Range of exam scores |
Standard Deviation | Average distance from mean | Spread of heights in a class |
z-score | Standardized position | z-score of a test result |
IQR | Middle 50% range | IQR of household incomes |
Additional info: These notes expand on brief points from the original guide, providing definitions, formulas, and examples for clarity and completeness.
