 Back
BackStep-by-Step Guidance for College Statistics Practice Questions
Study Guide - Smart Notes
 Tailored notes based on your materials, expanded with key definitions, examples, and context.
Q1. Determine whether the given value is a statistic or a parameter.
Background
Topic: Descriptive Statistics
This question tests your understanding of the difference between statistics (sample-based measures) and parameters (population-based measures).
Key Terms:
Statistic: A numerical measurement describing a characteristic of a sample.
Parameter: A numerical measurement describing a characteristic of a population.
Step-by-Step Guidance
Read the scenario carefully: A sample of professors is selected and it is found that 50% own a television.
Identify whether the value (50%) describes a sample or the entire population.
Recall the definitions: If the value is from a sample, it is a statistic; if from a population, it is a parameter.
Try solving on your own before revealing the answer!
Q2. Determine whether the data is a population or a sample. Explain your reasoning.
Background
Topic: Populations vs. Samples
This question tests your ability to distinguish between a population (entire group) and a sample (subset of the group).
Key Terms:
Population: The entire collection of individuals or items under study.
Sample: A subset of the population, selected for study.
Step-by-Step Guidance
Read the scenario: The temperature in four state capitals out of all state capitals.
Ask yourself: Are all state capitals included, or just a few?
Recall: If only a few are included, it is a sample; if all, it is a population.
Try solving on your own before revealing the answer!
Q3. Determine whether the data set is a population or a sample. Explain your reasoning.
Background
Topic: Populations vs. Samples
This question tests your ability to identify whether a data set represents a population or a sample.
Key Terms:
Population: All members of a defined group.
Sample: A subset of the population.
Step-by-Step Guidance
Read the scenario: Collection of ages for ten members of the Senate.
Determine if the data includes all members or just a subset.
Apply the definitions to decide if it is a sample or population.
Try solving on your own before revealing the answer!
Q4. Determine whether the variable is quantitative or qualitative. Explain your reasoning.
Background
Topic: Types of Variables
This question tests your understanding of quantitative (numerical) vs. qualitative (categorical) variables.
Key Terms:
Quantitative Variable: Takes numerical values and can be measured or counted.
Qualitative Variable: Describes attributes or characteristics, not numerical values.
Step-by-Step Guidance
Read the scenario: Is the variable describing a number or a characteristic?
Recall: Quantitative variables are measured numerically; qualitative variables are descriptive.
Apply the definitions to the variable in question.
Try solving on your own before revealing the answer!
Q5. Determine whether the variable is qualitative or quantitative. Explain your reasoning.
Background
Topic: Types of Variables
This question tests your ability to classify variables as quantitative or qualitative.
Key Terms:
Quantitative Variable: Measured numerically (e.g., miles per hour).
Qualitative Variable: Describes a quality or category.
Step-by-Step Guidance
Read the scenario: Miles per hour of a car traveling.
Ask: Is this a number that can be measured or counted?
Recall: Quantitative variables are numerical; qualitative variables are descriptive.
Try solving on your own before revealing the answer!
Q6. Determine whether the given description corresponds to an observational study or an experiment.
Background
Topic: Types of Studies
This question tests your ability to distinguish between observational studies and experiments.
Key Terms:
Observational Study: Researchers observe subjects without intervention.
Experiment: Researchers apply treatments and observe effects.
Step-by-Step Guidance
Read the scenario: Are subjects being observed or manipulated?
Recall: Observational studies do not involve intervention; experiments do.
Apply the definitions to the description provided.
Try solving on your own before revealing the answer!
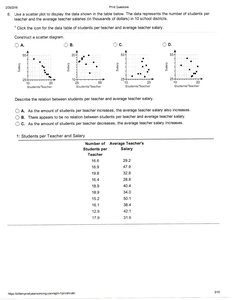
Q7. Use a scatter plot to display the data shown in the table. Describe the relation between students per teacher and average teacher salary.
Background
Topic: Data Visualization and Correlation
This question tests your ability to interpret scatter plots and describe relationships between two quantitative variables.
Key Terms and Formulas:
Scatter Plot: A graph that shows the relationship between two variables.
Correlation: The degree to which two variables move together.
Step-by-Step Guidance
Review the table: Number of students per teacher and average teacher salary.
Plot each pair (students per teacher, salary) as a point on the scatter plot.
Look for patterns: Does salary increase or decrease as students per teacher increases?
Describe the relationship: Is it positive, negative, or no correlation?
Try solving on your own before revealing the answer!
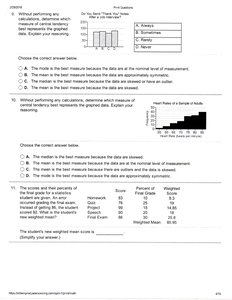
Q8. Without performing any calculations, determine which measure of central tendency best represents the given data. Explain your reasoning.
Background
Topic: Measures of Central Tendency
This question tests your understanding of mean, median, and mode, and when each is most appropriate.
Key Terms:
Mean: The average value.
Median: The middle value when data is ordered.
Mode: The most frequently occurring value.
Step-by-Step Guidance
Examine the data: Are values skewed, or is there a clear mode?
Recall: Mode is best for nominal data; median for skewed data; mean for symmetric data.
Apply reasoning to the data set provided.
Try solving on your own before revealing the answer!
Q9. Without performing any calculations, determine which measure of central tendency best represents the projected data. Explain your reasoning.
Background
Topic: Measures of Central Tendency
This question tests your ability to select the best measure of central tendency based on the data's characteristics.
Key Terms:
Mean: Sensitive to outliers.
Median: Resistant to outliers.
Mode: Most frequent value.
Step-by-Step Guidance
Examine the projected data: Is it skewed or symmetric?
Recall: Median is best for skewed data; mean for symmetric data.
Apply reasoning to the data set provided.
Try solving on your own before revealing the answer!
Q10. Calculate the student's new weighted mean score.
Background
Topic: Weighted Mean
This question tests your ability to calculate a weighted mean, which accounts for different weights assigned to each score.
Key Formula:
= weight for each score
= score
Step-by-Step Guidance
Identify the scores and their corresponding weights.
Multiply each score by its weight.
Sum the products and divide by the sum of the weights.
Try solving on your own before revealing the answer!
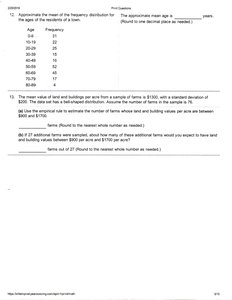
Q11. Approximate the mean of the frequency distribution for ages of the residents of a town.
Background
Topic: Mean of Frequency Distribution
This question tests your ability to estimate the mean from grouped data using midpoints and frequencies.
Key Formula:
= frequency of each class
= midpoint of each class
Step-by-Step Guidance
Find the midpoint for each class interval.
Multiply each midpoint by its frequency.
Sum the products and divide by the total frequency.
Try solving on your own before revealing the answer!
Q12. The mean value of land and buildings per acre from a sample of farms is $1300, with a standard deviation of $300. The data set has a bell-shaped distribution. Estimate the number of farms whose values are between $1000 and $1600.
Background
Topic: Empirical Rule (68-95-99.7 Rule)
This question tests your ability to apply the empirical rule to estimate proportions within standard deviations of the mean.
Key Formula:
Empirical Rule: For a normal distribution, approximately 68% of data falls within 1 standard deviation, 95% within 2, and 99.7% within 3.
Step-by-Step Guidance
Calculate how many standard deviations $1000 are from the mean ($1300$).
Determine the proportion of farms expected to fall within this range using the empirical rule.
Multiply the proportion by the total number of farms in the sample to estimate the count.
Try solving on your own before revealing the answer!
Q13. Find the z-score for the value in a normal distribution.
Background
Topic: Z-Scores and Standardization
This question tests your ability to calculate z-scores, which measure how many standard deviations a value is from the mean.
Key Formula:
= value
= mean
= standard deviation
Step-by-Step Guidance
Identify the value , mean , and standard deviation .
Subtract the mean from the value.
Divide the result by the standard deviation.
Try solving on your own before revealing the answer!
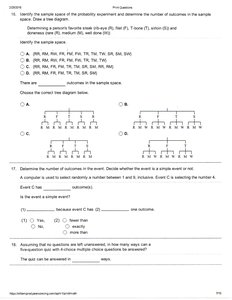
Q14. Identify the sample space of the probability experiment and determine the number of outcomes in the sample space. Draw a tree diagram.
Background
Topic: Probability and Sample Spaces
This question tests your ability to list all possible outcomes and visualize them using a tree diagram.
Key Terms:
Sample Space: The set of all possible outcomes.
Tree Diagram: A visual representation of all possible outcomes.
Step-by-Step Guidance
List all possible outcomes for the experiment.
Count the total number of outcomes.
Draw a tree diagram to represent the sample space visually.
Try solving on your own before revealing the answer!
Q15. Determine the probability of an event in a probability experiment.
Background
Topic: Probability
This question tests your ability to calculate the probability of an event using the formula for classical probability.
Key Formula:
Step-by-Step Guidance
Identify the number of favorable outcomes for the event.
Determine the total number of possible outcomes.
Plug the values into the probability formula.
Try solving on your own before revealing the answer!
Q16. Determine whether two events are mutually exclusive.
Background
Topic: Probability - Mutually Exclusive Events
This question tests your understanding of mutually exclusive events, which cannot occur at the same time.
Key Terms:
Mutually Exclusive: Events that cannot happen simultaneously.
Step-by-Step Guidance
Identify the two events described.
Ask: Can both events occur at the same time?
If not, they are mutually exclusive; if yes, they are not.
Try solving on your own before revealing the answer!
Q17. Perform the indicated calculation (e.g., combinations, permutations).
Background
Topic: Counting Principles
This question tests your ability to use formulas for combinations and permutations.
Key Formulas:
(factorial), (combinations), (permutations)
Step-by-Step Guidance
Identify whether the problem is asking for a combination or permutation.
Plug the values into the appropriate formula.
Calculate the intermediate steps (factorials, etc.).
Try solving on your own before revealing the answer!
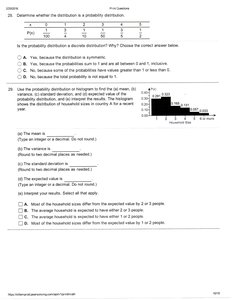
Q18. Determine whether the distribution is a probability distribution.
Background
Topic: Probability Distributions
This question tests your ability to recognize valid probability distributions.
Key Terms:
Probability Distribution: A function that assigns probabilities to each possible outcome.
Each probability must be between 0 and 1, and the sum must be 1.
Step-by-Step Guidance
Check that all probabilities are between 0 and 1.
Sum all probabilities to see if they equal 1.
Decide if the distribution meets the criteria.
Try solving on your own before revealing the answer!
Q19. Use the probability distribution to find the mean, variance, and standard deviation.
Background
Topic: Probability Distribution - Mean, Variance, Standard Deviation
This question tests your ability to calculate these measures from a probability distribution.
Key Formulas:
= value
= probability of
= mean
Step-by-Step Guidance
Multiply each value by its probability and sum to find the mean.
Subtract the mean from each value, square the result, multiply by the probability, and sum to find the variance.
Take the square root of the variance to find the standard deviation.
Try solving on your own before revealing the answer!
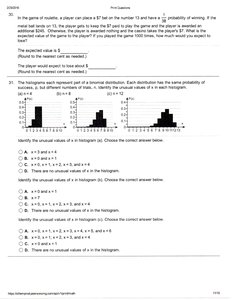
Q20. In the game of roulette, calculate the expected value for a bet.
Background
Topic: Expected Value
This question tests your ability to calculate expected value in a probability scenario.
Key Formula:
Step-by-Step Guidance
Identify the possible outcomes and their probabilities.
Multiply each outcome by its probability.
Sum the products to find the expected value.
Try solving on your own before revealing the answer!
Q21. Identify the mean and standard deviation in a binomial distribution from histograms.
Background
Topic: Binomial Distribution
This question tests your ability to interpret histograms and identify mean and standard deviation in binomial distributions.
Key Formulas:
= number of trials
= probability of success
Step-by-Step Guidance
Identify the number of trials and probability of success from the histogram or description.
Use the formulas to calculate mean and standard deviation.
Compare the histograms to see which matches the calculated values.
Try solving on your own before revealing the answer!
