 Back
BackStep-by-Step Guidance for College Statistics Hypothesis Testing Worksheet
Study Guide - Smart Notes
 Tailored notes based on your materials, expanded with key definitions, examples, and context.
Q1. A politician claims the mean prison time for car thieves is less than the required 4 years. A sample of 80 convicted car thieves was randomly selected, and the sample mean length of prison time was found to be 3.5 years, with a population standard deviation of 1.25 years. At α = 0.05, test the politician's claim.
Background
Topic: Hypothesis Testing for a Population Mean (Z-test)
This question tests your ability to conduct a hypothesis test for a population mean when the population standard deviation is known.
Key Terms and Formulas
Null hypothesis ():
Alternative hypothesis ():
Significance level (): 0.05
Z-test statistic formula:
= sample mean, = population mean, = population standard deviation, = sample size
Step-by-Step Guidance
State the hypotheses:
Identify the known values:
Calculate the standard error:
Set up the Z-test statistic formula:
Try solving on your own before revealing the answer!
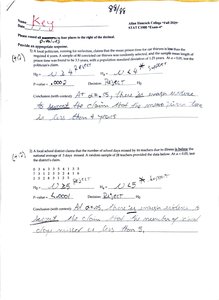
Final Answer: Z = -3.58, p-value < 0.05, Reject
There is enough evidence at the 0.05 significance level to support the claim that the mean prison time is less than 4 years.
Q2. A local school district claims that the number of school days missed by its teachers due to illness is below the national average of 5 days missed. A random sample of 28 teachers provided the data below. At α = 0.05, test the district's claim.
Background
Topic: Hypothesis Testing for a Population Mean (t-test)
This question tests your ability to conduct a hypothesis test for a population mean when the population standard deviation is unknown and the sample size is small.
Key Terms and Formulas
Null hypothesis ():
Alternative hypothesis ():
Significance level (): 0.05
t-test statistic formula:
= sample mean, = population mean, = sample standard deviation, = sample size
Step-by-Step Guidance
State the hypotheses:
Calculate the sample mean () and sample standard deviation () from the provided data.
Calculate the standard error:
Set up the t-test statistic formula:
Try solving on your own before revealing the answer!
Final Answer: t = -2.65, p-value < 0.05, Reject
There is enough evidence at the 0.05 significance level to support the claim that the mean number of school days missed is less than 5.
Q3. A survey claims that at least 18% of lower high school students are overweight. A sample of 84 students is taken. At α = 0.05, test the claim.
Background
Topic: Hypothesis Testing for a Population Proportion (Z-test)
This question tests your ability to conduct a hypothesis test for a population proportion.
Key Terms and Formulas
Null hypothesis ():
Alternative hypothesis ():
Significance level (): 0.05
Z-test statistic formula:
= sample proportion, = population proportion, = sample size
Step-by-Step Guidance
State the hypotheses:
Calculate the sample proportion () from the data.
Calculate the standard error:
Set up the Z-test statistic formula:
Try solving on your own before revealing the answer!
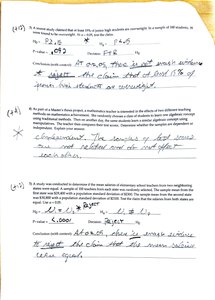
Final Answer: Z = -1.53, p-value > 0.05, Fail to Reject
There is not enough evidence at the 0.05 significance level to support the claim that less than 18% of students are overweight.
Q4. As part of a Master's thesis project, a mathematics teacher is interested in the effects of two different teaching methods on mathematics achievement. She randomly chooses a class of students to learn one algebraic concept using traditional methods, then on another day, the same students learn a similar concept using manipulatives. She compares their test scores. Are the samples dependent or independent? Explain your answer.
Background
Topic: Dependent vs. Independent Samples
This question tests your understanding of the difference between dependent and independent samples in experimental design.
Key Terms
Dependent samples: Samples where the same subjects are measured under different conditions.
Independent samples: Samples where different subjects are measured in each group.
Step-by-Step Guidance
Identify whether the same students are used for both teaching methods.
Consider if the scores from one method are related to the scores from the other method for each student.
Recall that dependent samples are often called paired or matched samples.
Try solving on your own before revealing the answer!
Final Answer: Dependent samples
The same students are measured under both conditions, so the samples are dependent.
Q5. A study was conducted to determine if the mean salaries of elementary school teachers from two neighboring states were equal. A sample of 100 teachers from each state was randomly selected. The sample mean from the first state was $29,400 with a population standard deviation of $2,300. The sample mean from the second state was $30,800 with a population standard deviation of $2,100. Test the claim that the salaries from both states are equal. Use α = 0.05.
Background
Topic: Hypothesis Testing for the Difference Between Two Means (Z-test)
This question tests your ability to compare two population means using a Z-test when population standard deviations are known.
Key Terms and Formulas
Null hypothesis ():
Alternative hypothesis ():
Significance level (): 0.05
Z-test statistic formula:
, = sample means, , = population standard deviations, , = sample sizes
Step-by-Step Guidance
State the hypotheses:
Identify the known values:
, ,
, ,
Calculate the standard error:
Set up the Z-test statistic formula:
Try solving on your own before revealing the answer!
Final Answer: Z = -4.13, p-value < 0.05, Reject
There is enough evidence at the 0.05 significance level to support the claim that the mean salaries are not equal.
Q6. A sports analyst claims that the mean batting average for teams in the American League is not equal to the mean batting average for teams in the National League. The data listed below are random, independent, and normally distributed. At α = 0.05, test the analyst's claim. Assume the population variances are equal.
Background
Topic: Hypothesis Testing for the Difference Between Two Means (t-test, equal variances)
This question tests your ability to compare two population means using a t-test when population variances are assumed equal.
Key Terms and Formulas
Null hypothesis ():
Alternative hypothesis ():
Significance level (): 0.05
t-test statistic formula (pooled variance):
Pooled variance:
, = sample means, , = sample standard deviations, , = sample sizes
Step-by-Step Guidance
State the hypotheses:
Calculate the sample means and sample standard deviations for each league.
Calculate the pooled variance ().
Set up the t-test statistic formula:
Try solving on your own before revealing the answer!
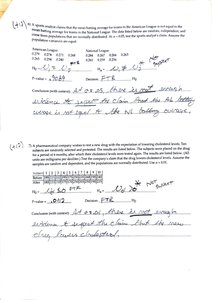
Final Answer: t = -0.89, p-value > 0.05, Fail to Reject
There is not enough evidence at the 0.05 significance level to support the claim that the mean batting averages are not equal.
Q7. A pharmaceutical company wishes to test a new drug with the expectation of lowering cholesterol levels. Ten subjects are randomly selected and pretested. The subjects were placed on the drug for 6 months, after which their cholesterol levels were tested again. Test the company's claim that the drug lowers cholesterol levels. Assume the samples are random and dependent, and the populations are normally distributed. Use α = 0.01.
Background
Topic: Hypothesis Testing for Paired (Dependent) Samples
This question tests your ability to conduct a hypothesis test for the mean difference in paired samples.
Key Terms and Formulas
Null hypothesis ():
Alternative hypothesis ():
Significance level (): 0.01
t-test statistic formula:
= mean difference, = standard deviation of differences, = number of pairs
Step-by-Step Guidance
State the hypotheses:
Calculate the difference for each subject (before - after).
Calculate the mean difference () and standard deviation of differences ().
Set up the t-test statistic formula:
Try solving on your own before revealing the answer!
Final Answer: t = -2.97, p-value < 0.01, Reject
There is enough evidence at the 0.01 significance level to support the claim that the drug lowers cholesterol levels.
