 Back
BackStep-by-Step Guidance for Hypothesis Testing About a Mean (σ Not Known)
Study Guide - Smart Notes
 Tailored notes based on your materials, expanded with key definitions, examples, and context.
Q1. What requirements must be satisfied to test the claim that the salaries are from a population with a mean greater than 5 million dollars?
Background
Topic: Hypothesis Testing for a Population Mean (σ Not Known)
This question is about the requirements for conducting a t-test for a population mean when the population standard deviation is not known. Understanding these requirements ensures the validity of the test results.
Key Terms and Formulas
Simple Random Sample: Every member of the population has an equal chance of being selected.
Normality: The population should be normally distributed, or the sample size should be large (n > 30) due to the Central Limit Theorem.
Step-by-Step Guidance
Check if the sample is a simple random sample. This is important to ensure that the sample is representative of the population.
Determine if the population is normally distributed, or if the sample size is large enough (n > 30) for the Central Limit Theorem to apply.
If the sample size is small and the population distribution is unknown or not normal, the t-test may not be appropriate.
Try solving on your own before revealing the answer!
Final Answer:
The sample must be a simple random sample.
Either the population must be normally distributed, or the sample size must be greater than 30.
These requirements ensure the validity of the t-test for a population mean when σ is not known.
Q2. EX 2: The claim is that weights (grams) of quarters made after 1964 have a mean equal to 5.670 g as required by mint specifications. The sample size is n = 40 and the test statistic is t = -3.135. Use a significance level of 0.01.
Background
Topic: Hypothesis Testing for a Population Mean (σ Not Known)
This question involves conducting a t-test to evaluate a claim about the mean weight of quarters. You are given the test statistic and asked to interpret the results using a significance level.
Key Terms and Formulas
Null Hypothesis (H0): The population mean is equal to the claimed value.
Alternative Hypothesis (H1): The population mean is different from the claimed value.
Test Statistic (t):
P-value: The probability of obtaining a test statistic as extreme as the observed value, assuming the null hypothesis is true.
Significance Level (α): The threshold for rejecting the null hypothesis (here, α = 0.01).
Step-by-Step Guidance
State the null and alternative hypotheses: and .
Identify the test statistic (already given as t = -3.135).
Find the P-value associated with the test statistic and the degrees of freedom (n - 1).
Compare the P-value to the significance level (α = 0.01) to decide whether to reject the null hypothesis.
Try solving on your own before revealing the answer!
Final Answer:
Null hypothesis:
Alternative hypothesis:
Test statistic: t = -3.135
P-value: The P-value is less than 0.01.
Conclusion: Reject the null hypothesis. There is sufficient evidence to warrant rejection of the claim that the mean weight of quarters is equal to 5.670 g.
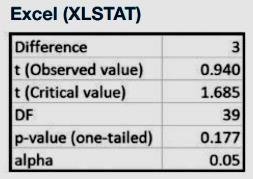
Q3. EX 3: Using the first 40 wait times for the Tower of Terror ride, test the claim that the mean wait time is more than 30 minutes. Use the Excel display provided and a 0.05 significance level.
Background
Topic: Hypothesis Testing for a Population Mean (σ Not Known) Using Technology Output
This question asks you to interpret the results of a t-test using output from Excel (XLSTAT) to test a claim about the mean wait time for a ride.
Key Terms and Formulas
Null Hypothesis (H0): The population mean is equal to 30 minutes.
Alternative Hypothesis (H1): The population mean is greater than 30 minutes.
Test Statistic (t):
P-value: The probability of observing a test statistic as extreme as the one calculated, assuming the null hypothesis is true.
Critical Value: The cutoff value for the test statistic at the chosen significance level.
Step-by-Step Guidance
State the null and alternative hypotheses: and .
Identify the test statistic (from the Excel output: t = 0.940).
Find the P-value (from the Excel output: 0.177).
Compare the P-value to the significance level (α = 0.05) to determine whether to reject the null hypothesis.
Try solving on your own before revealing the answer!
Final Answer:
Null hypothesis:
Alternative hypothesis:
Test statistic: t = 0.940
P-value: 0.177
Conclusion: Since the P-value is greater than 0.05, do not reject the null hypothesis. There is not sufficient evidence to support the claim that the mean wait time is more than 30 minutes.
Q4. EX 4: Use a 0.01 significance level to test the claim that the sample of 300 systolic blood pressure levels (mean = 122.96, s = 15.85) is from a population with a mean greater than 120 mm Hg.
Background
Topic: Hypothesis Testing for a Population Mean (σ Not Known)
This question involves using a t-test to determine if the mean systolic blood pressure is greater than a specified value.
Key Terms and Formulas
Null Hypothesis (H0): The population mean is equal to 120 mm Hg.
Alternative Hypothesis (H1): The population mean is greater than 120 mm Hg.
Test Statistic (t):
P-value: The probability of observing a test statistic as extreme as the one calculated, assuming the null hypothesis is true.
Step-by-Step Guidance
State the null and alternative hypotheses: and .
Calculate the test statistic using the formula and the given values (mean, standard deviation, sample size).
Find the P-value for the calculated t statistic with the appropriate degrees of freedom (n - 1).
Compare the P-value to the significance level (α = 0.01) to decide whether to reject the null hypothesis.
Try solving on your own before revealing the answer!
Final Answer:
Null hypothesis:
Alternative hypothesis:
Test statistic: t ≈ 2.22
P-value: less than 0.01
Conclusion: There is sufficient evidence to support the claim that the sample is from a population with a mean greater than 120 mm Hg.
Q5. EX 5: Use a 0.05 significance level to test the claim that the sample of 21 children with high lead exposure (mean IQ = 86.90, s = 8.99) is from a population with mean IQ equal to 100. Do the results prove that exposure to lead has an adverse effect on IQ scores?
Background
Topic: Hypothesis Testing for a Population Mean (σ Not Known)
This question asks you to test a claim about the mean IQ of a sample and interpret the results in the context of lead exposure.
Key Terms and Formulas
Null Hypothesis (H0): The population mean is equal to 100.
Alternative Hypothesis (H1): The population mean is not equal to 100.
Test Statistic (t):
P-value: The probability of observing a test statistic as extreme as the one calculated, assuming the null hypothesis is true.
Step-by-Step Guidance
State the null and alternative hypotheses: and .
Calculate the test statistic using the formula and the given values (mean, standard deviation, sample size).
Find the P-value for the calculated t statistic with the appropriate degrees of freedom (n - 1).
Compare the P-value to the significance level (α = 0.05) to decide whether to reject the null hypothesis.
Try solving on your own before revealing the answer!
Final Answer:
Null hypothesis:
Alternative hypothesis:
Test statistic: t ≈ -6.13
P-value: much less than 0.05
Conclusion: There is sufficient evidence to warrant rejection of the claim that the sample of children is from a population with mean IQ equal to 100. These results do not prove causation, but strongly suggest an adverse effect is possible.
Q6. EX 6: Use a 0.01 significance level to test the claim that the sample of cell phones (radiation levels: 0.97, 1.38, 0.93, 1.52, 1.37, 1.09, 0.48, 0.65) is from a population with a mean amount of radiation less than the FCC standard of 1.6 W/kg.
Background
Topic: Hypothesis Testing for a Population Mean (σ Not Known)
This question involves using a t-test to determine if the mean radiation level of cell phones is less than the FCC standard.
Key Terms and Formulas
Null Hypothesis (H0): The population mean is equal to 1.6 W/kg.
Alternative Hypothesis (H1): The population mean is less than 1.6 W/kg.
Test Statistic (t):
P-value: The probability of observing a test statistic as extreme as the one calculated, assuming the null hypothesis is true.
Step-by-Step Guidance
State the null and alternative hypotheses: and .
Calculate the sample mean and standard deviation from the data provided.
Calculate the test statistic using the formula and the calculated values.
Find the P-value for the calculated t statistic with the appropriate degrees of freedom (n - 1).
Compare the P-value to the significance level (α = 0.01) to decide whether to reject the null hypothesis.
Try solving on your own before revealing the answer!
Final Answer:
Null hypothesis:
Alternative hypothesis:
Test statistic: t ≈ -3.13
P-value: less than 0.01
Conclusion: There is sufficient evidence to support the claim that the sample is from a population of cell phones with a mean amount of radiation that is less than the FCC standard of 1.6 W/kg.
