 Back
BackStep-by-Step Guidance for Probability and Confidence Interval Questions (Statistics)
Study Guide - Smart Notes
 Tailored notes based on your materials, expanded with key definitions, examples, and context.
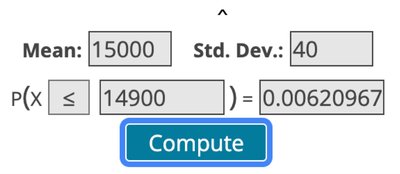
Q3. The time to failure for light bulbs has a mean hours and a standard deviation hours. We randomly sample 75 light bulbs and calculate the sample mean. Round probabilities to 4 decimal places.
Background
Topic: Sampling Distributions & Normal Probability
This question tests your understanding of the sampling distribution of the sample mean, and how to use the normal distribution to calculate probabilities for sample means.
Key Terms and Formulas
Sampling Distribution: The probability distribution of a statistic (like the sample mean) based on repeated samples from the population.
Central Limit Theorem: For large samples, the sampling distribution of the sample mean is approximately normal, regardless of the population's shape.
Standard Error of the Mean:
Z-score for sample mean:
Probability: Use the standard normal table or calculator to find or .
Step-by-Step Guidance
Calculate the standard error of the mean using and :
For each probability question, convert the sample mean value to a z-score:
Use the z-score to find the probability from the standard normal distribution (using a table or calculator).
For questions about percentiles, set and solve for using the z-score formula and the inverse normal function.
Try solving on your own before revealing the answer!
Final Answer:
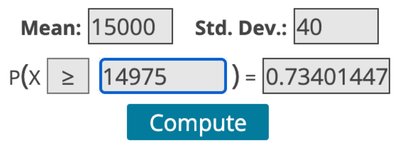
For example, for part (a):
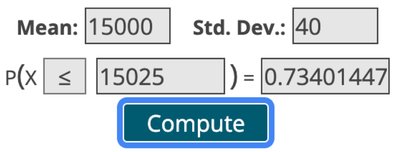
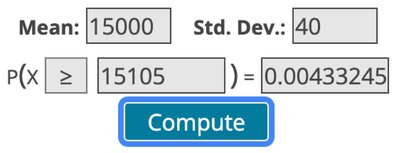
For part (b):
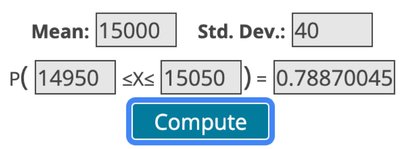
For part (c):
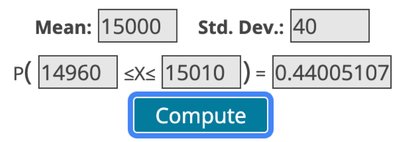
For part (d):
For part (e):
For part (f):
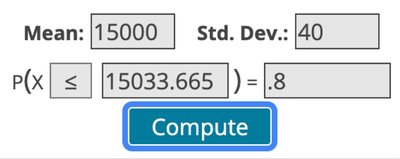
For part (g):
The 80th percentile for the sample mean is hours.
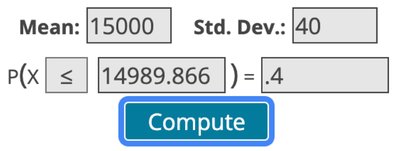
For part (h):
40% of all possible sample means are less than hours.
These answers are found using the z-score formula and normal probability calculations.
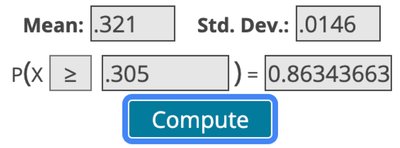
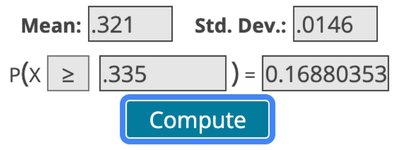
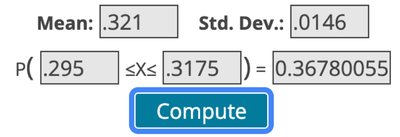
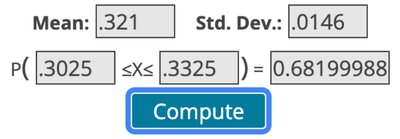
Q4. According to the 2024 AVMA Pet Ownership and Demographic Sourcebook, 32.1% of US households own a cat. We randomly select 1024 households and determine the proportion who own a cat. Round all answers to 4 decimal places.
Background
Topic: Sampling Distribution of Sample Proportion & Normal Probability
This question tests your ability to use the sampling distribution of the sample proportion and calculate probabilities for proportions using the normal approximation.
Key Terms and Formulas
Sample Proportion:
Standard Error for Proportion:
Z-score for sample proportion:
Probability: Use the standard normal table or calculator to find or .
Step-by-Step Guidance
Calculate the standard error for the sample proportion using and :
For each probability question, convert the sample proportion value to a z-score:
Use the z-score to find the probability from the standard normal distribution (using a table or calculator).
For questions about percentiles, set and solve for using the z-score formula and the inverse normal function.
Try solving on your own before revealing the answer!
Final Answer:
For example, for part (a):
For part (b):
For part (c):
For part (d):
For part (e):
For part (f):
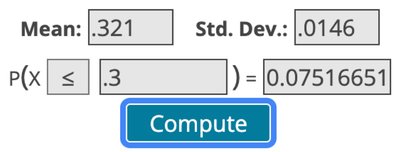
For part (g):
The 25th percentile for the sample proportion is .
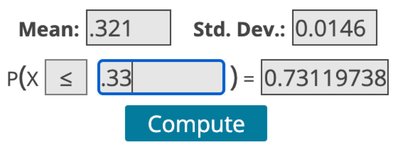
For part (h):
60% of all possible sample proportions are less than .

These answers are found using the z-score formula and normal probability calculations.
Q5. The Texas Department of Agriculture collected the following weights (in pounds) from 10 randomly selected pecan trees: 126, 114, 98, 158, 140, 92, 107, 119, 103, 123. Construct a 90% confidence interval for the mean weight of nuts harvested from pecan trees. Interpret this confidence interval using full sentences.
Background
Topic: Confidence Intervals for the Mean (t-distribution)
This question tests your ability to construct a confidence interval for the mean when the population standard deviation is unknown and the sample size is small.
Key Terms and Formulas
Sample Mean:
Sample Standard Deviation:
Standard Error:
Critical Value (t): Use t-distribution with degrees of freedom
Confidence Interval:
Step-by-Step Guidance
Calculate the sample mean and sample standard deviation from the data.
Calculate the standard error using .
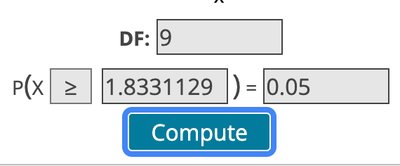
Find the critical t-value for 90% confidence and degrees of freedom.
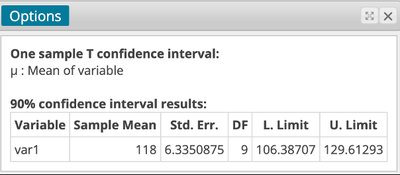
Calculate the margin of error: .
Construct the confidence interval: .
Try solving on your own before revealing the answer!
Final Answer:
The 90% confidence interval for the mean weight is (106.39, 129.61) pounds.
Interpretation: We are 90% confident that the mean weight of nuts harvested from all pecan trees is between 106.39 lbs and 129.61 lbs.
