 Back
BackStep-by-Step Guidance for STAT211 Midterm Exam 1
Study Guide - Smart Notes
 Tailored notes based on your materials, expanded with key definitions, examples, and context.
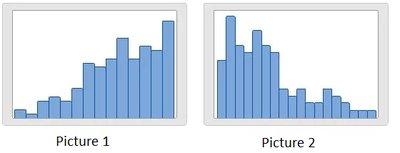
Q2. Which statement is true for Picture 1? Which statement is true for Picture 2?
Background
Topic: Distribution Shape and Measures of Central Tendency
This question tests your ability to interpret histograms and understand the relationship between skewness and the mean/median.
Key Terms:
Skewness: Describes the direction of the tail of a distribution. Left (negative) skew means the tail is on the left; right (positive) skew means the tail is on the right.
Mean: The average value of the data.
Median: The middle value when the data is ordered.
Key Concept:
In a right-skewed distribution, the mean is typically greater than the median.
In a left-skewed distribution, the mean is typically less than the median.
Step-by-Step Guidance
Examine Picture 1: Notice that the bars are higher on the left and the tail extends to the right. This suggests a right-skewed distribution.
Recall that for a right-skewed distribution, the mean is usually greater than the median.
Examine Picture 2: The bars are higher on the right and the tail extends to the left. This suggests a left-skewed distribution.
Recall that for a left-skewed distribution, the mean is usually less than the median.
Try solving on your own before revealing the answer!
Final Answer:
Picture 1: D. The distribution is right skewed, and the median is smaller than the mean. Picture 2: C. The distribution is left skewed, and the median is greater than the mean.
We used the shape of the histogram to determine the skewness and then applied the relationship between mean and median for skewed distributions.
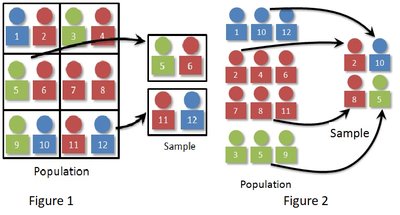
Q5. Which one best describes the sampling strategy for Figure 1? Which one best describes the sampling strategy for Figure 2?
Background
Topic: Sampling Methods
This question tests your understanding of different sampling strategies used in statistics to select samples from a population.
Key Terms:
Random Sampling: Every member of the population has an equal chance of being selected.
Systematic Sampling: Selects every nth member from a list.
Cluster Sampling: Divides the population into groups (clusters) and randomly selects entire clusters.
Stratified Sampling: Divides the population into strata and randomly samples from each stratum.
Step-by-Step Guidance
Look at Figure 1: The population is divided into groups, and entire groups are selected for the sample. This is characteristic of cluster sampling.
Look at Figure 2: The population is divided into groups based on color, and samples are taken from each group. This is characteristic of stratified sampling.
Compare the visual cues in each figure to the definitions of sampling methods above.
Try solving on your own before revealing the answer!
Final Answer:
Figure 1: C. Cluster sampling Figure 2: D. Stratified sampling
Figure 1 shows entire groups being sampled, while Figure 2 shows samples from each subgroup, matching the definitions of cluster and stratified sampling.
